- Last week EUR/JPY broke the trendline to the upside and the price has come back to test it on Tuesday.
- The pair is still under the 200 Simple Moving Average (SMA) and could use it as a resistance zone.
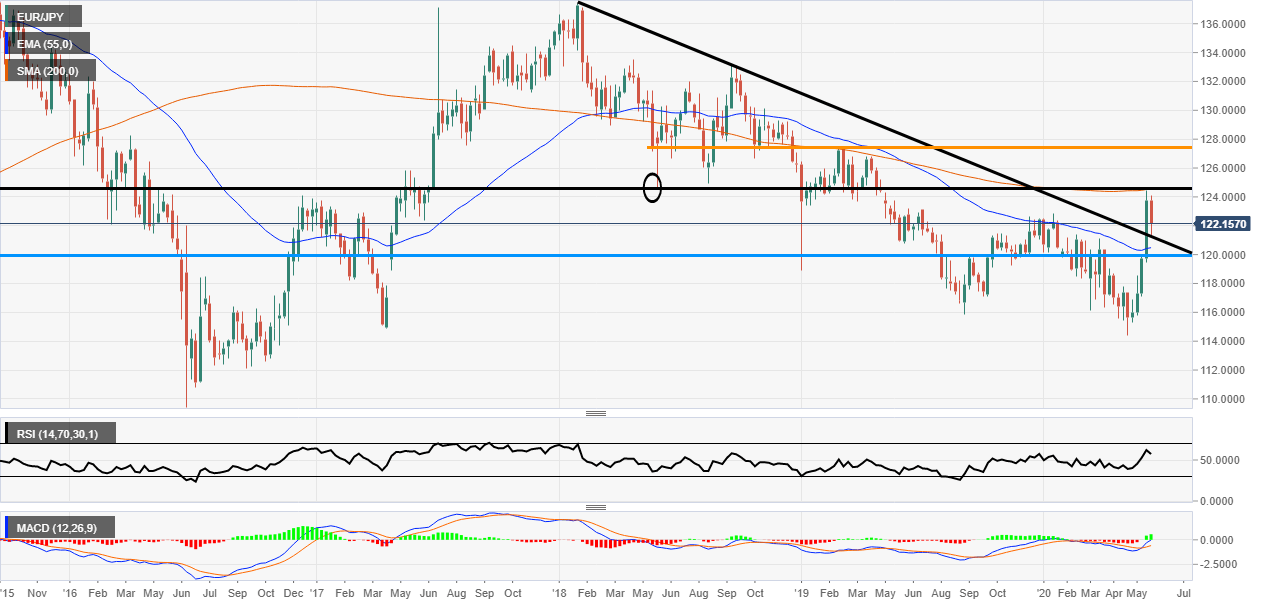
EUR/JPY weekly chart
EUR/JPY was on a good run last week (1st-5th June) but on Tuesday the pair has fallen due to the demand for safe-havens. The pair trades 0.23% lower on the session but has now pushed higher after testing the trendline.
The black resistance line held firm and it was used as a support zone back in June 2019 and as a resistance zone on 16th December 2016 so it has good pedigree. Close to that resistance line is the 200 SMA. The price got close to it but just sold off ahead of the zone.
The technical indicators are looking good on this timeframe as the MACD histogram has moved into the green and the Relative Strength Index is firmly above the 50 mid-line.
EUR/JPY daily chart
The daily chart is obviously a close up of the weekly above. It is showing a very different picture where the market looks overbought. The test of the trendline looks much clearer on this chart and it provided a good long opportunity. However, the market does look like it could correct slightly more as the indicators are overextended to the upside. The psychological 120.00 level looks like it could be the best-looking support if the correction is extended.
-637273222842246832.png)
