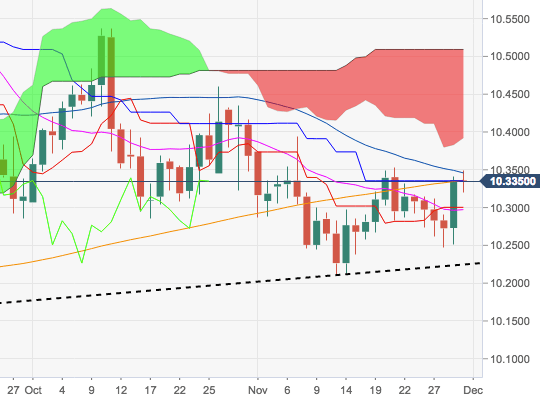
- EUR/SEK is alternating gains with losses in the upper end of the weekly range in the 10.3300 region, where is located the key 200-day SMA.
- Recently, poor data in the Scandinavian economy weighed on SEK and pushed the cross to multi-day peaks near the immediate target at/above 10.3500.
- Further upside is still probable while above the 6-month support line, today at 10.2200, coincident with recent lows near 10.2000.
- Volatility around SEK is expected to come from domestic politics and the likely rate hike by the Riksbank at some point by year-end or early 2019.
EUR/SEK daily chart
EUR/SEK
Overview:
Today Last Price: 10.3339
Today Daily change: -23 pips
Today Daily change %: -0.0223%
Today Daily Open: 10.3362
Trends:
Previous Daily SMA20: 10.2949
Previous Daily SMA50: 10.3419
Previous Daily SMA100: 10.3867
Previous Daily SMA200: 10.3312
Levels:
Previous Daily High: 10.3405
Previous Daily Low: 10.2506
Previous Weekly High: 10.3507
Previous Weekly Low: 10.2676
Previous Monthly High: 10.5375
Previous Monthly Low: 10.2863
Previous Daily Fibonacci 38.2%: 10.3062
Previous Daily Fibonacci 61.8%: 10.2849
Previous Daily Pivot Point S1: 10.2777
Previous Daily Pivot Point S2: 10.2192
Previous Daily Pivot Point S3: 10.1878
Previous Daily Pivot Point R1: 10.3676
Previous Daily Pivot Point R2: 10.399
Previous Daily Pivot Point R3: 10.4575
