EUR/USD has stabilized above 1.09, fighting the dollar’s strength amid the coronavirus outbreak. How is the currency pair positioned on the technical charts?
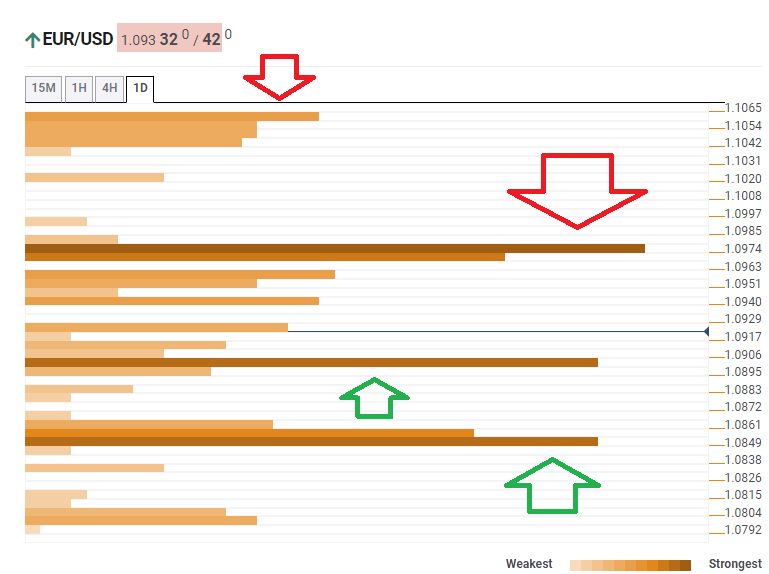
The Technical Confluences Indicator is showing that strong support awaits at 1.0901, which is the convergence of the Fibonacci 38.2% one-day, the Fibonacci 38.2% one-month, and more.
Further down, the next cushion awaits at 1.0849, which is the meeting point of the Pivot Point one-month Support 1, the Fibonacci 23.6% one-month, and the Fibonacci 23.6% one-day.
Fierce resistance awaits at 1.0974, which is the meeting point of the Fibonacci 61.8% one-month, the Fibonacci 61.8% one-day, and the Simple Moving Average 10-4h.
The upside target is 1.1054, where the previous weekly low and the Bollinger Band 4h-Middle converge.
Here is how it looks on the tool:
Confluence Detector
The Confluence Detector finds exciting opportunities using Technical Confluences. The TC is a tool to locate and point out those price levels where there is a congestion of indicators, moving averages, Fibonacci levels, Pivot Points, etc. Knowing where these congestion points are located is very useful for the trader, and can be used as a basis for different strategies.
This tool assigns a certain amount of “weight” to each indicator, and this “weight” can influence adjacents price levels. These weightings mean that one price level without any indicator or moving average but under the influence of two “strongly weighted” levels accumulate more resistance than their neighbors. In these cases, the tool signals resistance in apparently empty areas.
Learn more about Technical Confluence
