EUR/USD enjoyed an easier path to the upside on Wednesday but this is over and on Thursday, the downside is more appealing once again.
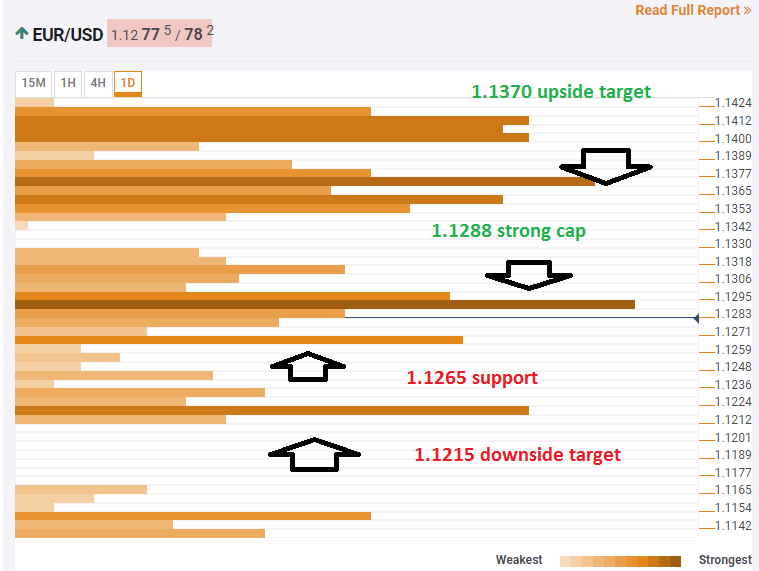
The Technical Confluences Indicator shows that the pair is capped at around 1.1288 where we see a cluster including the Fibonacci 23.6% one-day, the Bollinger Band 15min-Upper, the Simple Moving Average 5-4h, last month’s low, the SMA 100-15m, and the Fibonacci 38.2% one-day.
From there, euro/dollar has room to run all the way to around 1.1370 which is the convergence of the SMA 10-1d, the Pivot Point one-day 1d-R2, the Fibonacci 23.6% one-week, and the Fibonacci 23.6% one-month.
Looking down, 1.1265 provides some support with the previous 4h low, the BB 1d-Lower, and the previous day’s low.
The more significant downside target is at 1.1215 which is the 2018 trough and the Pivot Point one-day Support 2.
Here is how it looks on the tool:
Confluence Detector
The Confluence Detector finds exciting opportunities using Technical Confluences. The TC is a tool to locate and point out those price levels where there is a congestion of indicators, moving averages, Fibonacci levels, Pivot Points, etc. Knowing where these congestion points are located is very useful for the trader, and can be used as a basis for different strategies.
This tool assigns a certain amount of “weight” to each indicator, and this “weight” can influence adjacents price levels. These weightings mean that one price level without any indicator or moving average but under the influence of two “strongly weighted” levels accumulate more resistance than their neighbors. In these cases, the tool signals resistance in apparently empty areas.
