EUR/USD is trading around 1.1300, consolidating its gains that were fueled by the weak US Non-Farm Payrolls. Where next for the world’s most popular currency pair?
The Technical Confluences Indicator faces resistance around 1.1344where we note the convergence of the Pivot Point one-month Resistance 2, the Bollinger Band 4h-Upper, and the previous one-day high.
The next cap is 1.1366 which is the confluence of the Simple Moving Average 200-one-day, the PP one-day R1, the Fibonacci 161.8% one-month, and the BB 1h-Upper.
?Higher up, 1.1415 which is where two pivot points coincide – the one-day R2 and the one-month R3.
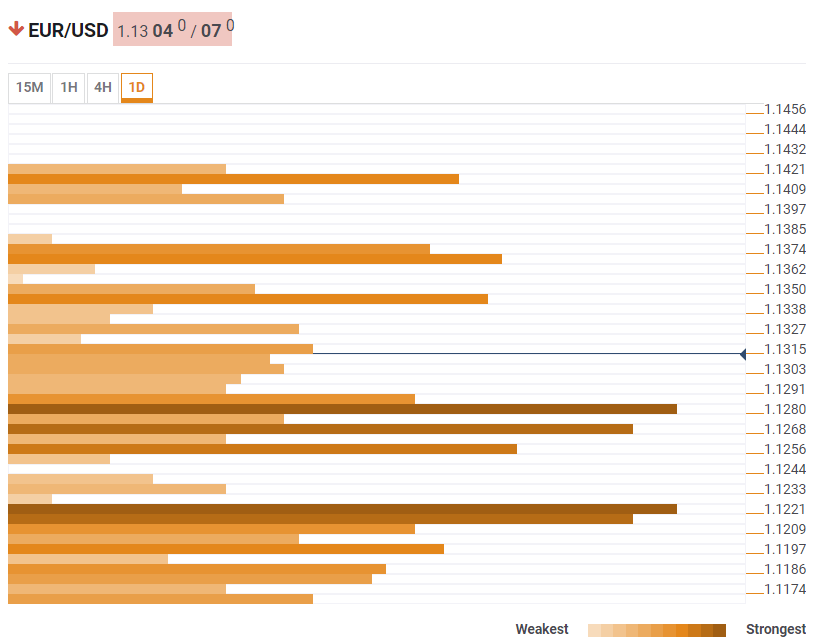
Looking down, support awaits at 1.1280 which is a dense cluster that includes the BB 4h-Middle, the SMA 100-1d, the Fibonacci 38.2% one-week, the SMA 200-15m, and the SMA 50-1h.
It is closely followed by 1.1268 which is the meeting point of the SMA 5-1d, the previous monthly high, and the SMA 100-1h.
The final support line, for now, is 1.1221 which where the previous yearly low and the SMA 50-4h converge.
Here is how it looks on the tool:
Confluence Detector
The Confluence Detector finds exciting opportunities using Technical Confluences. The TC is a tool to locate and point out those price levels where there is a congestion of indicators, moving averages, Fibonacci levels, Pivot Points, etc. Knowing where these congestion points are located is very useful for the trader, and can be used as a basis for different strategies.
This tool assigns a certain amount of “weight” to each indicator, and this “weight” can influence adjacents price levels. These weightings mean that one price level without any indicator or moving average but under the influence of two “strongly weighted” levels accumulate more resistance than their neighbors. In these cases, the tool signals resistance in apparently empty areas.
