EUR/USD sticks to a narrow range around 1.1300 after Fed officials provide conflicting messages and markets remain calm ahead of Easter. Where next? It is hovering above critical support.
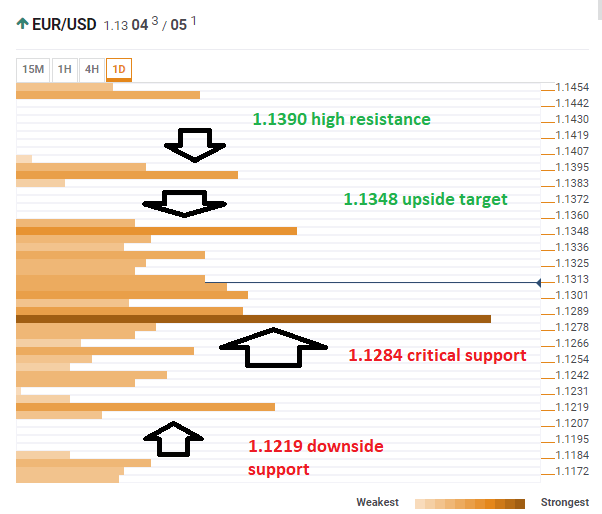
The Technical Confluences Indicator shows that EUR/USD enjoys substantial support around 1.1284 where a dense cluster awaits the pair. It includes the Simple Moving Average 5-one-day, the Fibonacci 38.2% one-month, the Fibonacci 38.2% one-week, the Pivot Point one-day Support 2, the SMA 200-4h, the SMA 100-1h, the Bollinger Band one-day Middle, and more.
If it breaks lower, further support awaits at 1.1219 where the previous yearly low, the previous weekly low, and the Pivot Point one-week S1 converge.
Resistance awaits at 1.1348 where the Fibonacci 61.8% one-month, the PP 1w-R1, the SMA 100-1d, and the PP 1d-R3 all meet.
Further above, 1.1390 is the confluence of the PP 1w-R2, the BB 1d-Upper, and the PP 1m-R1.
All in all, it all depends on the critical support line at 1.1284.
Here is how it looks on the tool:
Confluence Detector
The Confluence Detector finds exciting opportunities using Technical Confluences. The TC is a tool to locate and point out those price levels where there is a congestion of indicators, moving averages, Fibonacci levels, Pivot Points, etc. Knowing where these congestion points are located is very useful for the trader, and can be used as a basis for different strategies.
This tool assigns a certain amount of “weight” to each indicator, and this “weight” can influence adjacents price levels. These weightings mean that one price level without any indicator or moving average but under the influence of two “strongly weighted” levels accumulate more resistance than their neighbors. In these cases, the tool signals resistance in apparently empty areas.
