EUR/USD dropped from the highs it rushed to after the FOMC Meeting Minutes sent the dollar down. Where next for the pair? The downside seems well defended, but hurdles await on the upside as well.
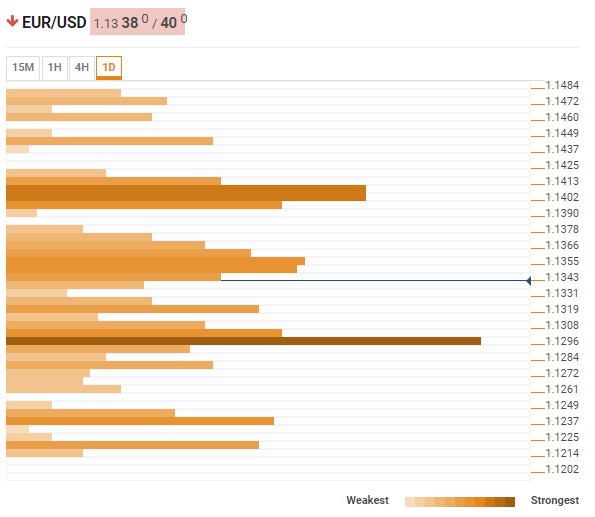
The Technical Confluences Indicator shows that the pair has significant support at around 1.1296 where we see the potent Pivot Point one-month Support 1, the Pivot Point one-day Support 2, and last month’s low converge.
Further, weaker support awaits at 1.1237 which is the confluence of last week’s low, the Bollinger Band one-day Lower, and the PP 1m-S1.
Looking up, resistance is quite close. Around 1.1350, a minefield of lines may slow any upwards movement. This includes the Fibonacci 38.2% one-day, the Simple Moving Average 100-15m, the SMA 10-4h, the BB 1h-Middle, and the SMA 5-4h.
A more powerful hurdle awaits around 1.1402 which is the convergence of the Fibonacci 161.8% one-day, the Fibonacci 38.2% one-month, the SMA 100-1d, and the PP one-week Resistance 2.
Here is how it looks on the tool:
Confluence Detector
The Confluence Detector finds exciting opportunities using Technical Confluences. The TC is a tool to locate and point out those price levels where there is a congestion of indicators, moving averages, Fibonacci levels, Pivot Points, etc. Knowing where these congestion points are located is very useful for the trader, and can be used as a basis for different strategies.
This tool assigns a certain amount of “weight” to each indicator, and this “weight” can influence adjacents price levels. These weightings mean that one price level without any indicator or moving average but under the influence of two “strongly weighted” levels accumulate more resistance than their neighbors. In these cases, the tool signals resistance in apparently empty areas.
