EUR/USD kicked off the week with a weekend gap to the upside but was unable to hold onto the gains. What’s next?
The Technical Confluences Indicator shows that the pair is struggling with 1,1368 where we see a dense cluster of lines including the Fibonacci 61.8% one-week, the Bollinger Band 15min-Middle, the Fibonacci 23.6% one-day, the Simple Moving Average 200-4h, the SMA 50-15m, and the BB 15min-Upper.
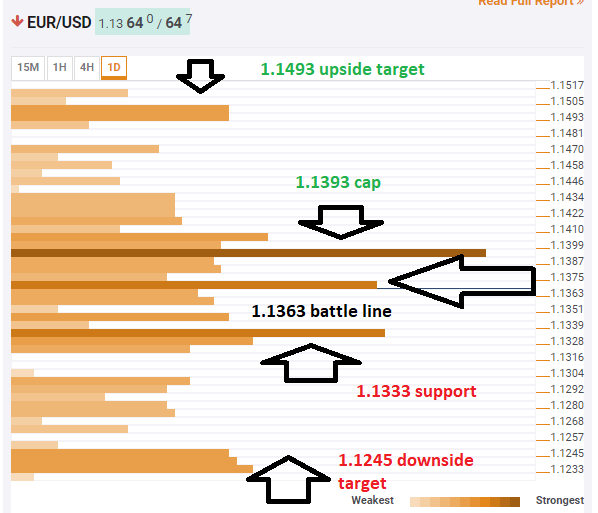
Robust resistance awaits the pair at 1.1393where we see the convergence of the SMA 100-1d, the Fibonacci 61.8% one-day, the Fibonacci 61.8% one-month, and the BB 1h-Upper.
If EUR/USD overcomes that level, the next upside target is 1.1493 where last month’s high converges with the PP 1m-R1.
Support is at 1.1333 which is the confluence of last week’s low, the Fibonacci 38.2% one-month, and the SMA 100-4h.
The downside target is 1.1245 where we see last month’s low, the PP 1m-S3, and the PP 1m-S1 meet.
Here is how it looks on the tool:
Confluence Detector
The Confluence Detector finds exciting opportunities using Technical Confluences. The TC is a tool to locate and point out those price levels where there is a congestion of indicators, moving averages, Fibonacci levels, Pivot Points, etc. Knowing where these congestion points are located is very useful for the trader, and can be used as a basis for different strategies.
This tool assigns a certain amount of “weight” to each indicator, and this “weight” can influence adjacents price levels. These weightings mean that one price level without any indicator or moving average but under the influence of two “strongly weighted” levels accumulate more resistance than their neighbors. In these cases, the tool signals resistance in apparently empty areas.
