EUR/USD tumbled down to the lowest levels in 22 months on Thursday, hitting 1.1112 as the greenback gained ground across the board. It then managed to recover awaiting the US GDP report. What’s next?
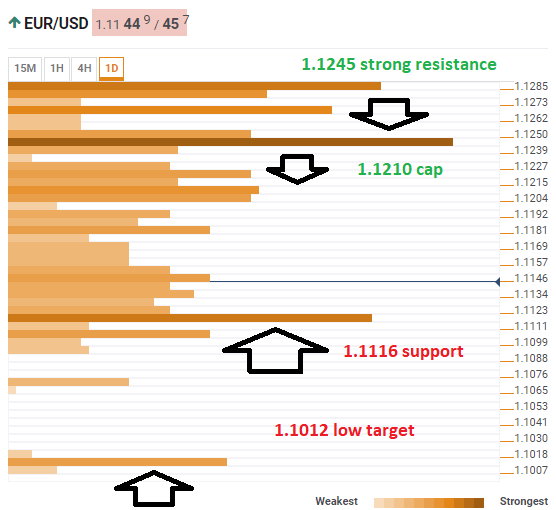
The Technical Confluences Indicator shows that EUR/USD enjoys substantial support at around 1.1116which is the convergence of the Pivot Point one-day Support 1, the PP 1m-S1, the previous daily low, and the Bollinger Band 1h-Lower.
If it loses this line, the next cushion is only at 1.1012which is the Pivot Point one-month Support 2.
Looking up, some resistance awaits at 1.1210 where we see the PP one-day R3, the PP 1w-S1, the Simple Moving Average 100-1h, the SMA 5-1d, the PP 1d-R3, and the PP 1w-S3.
The next cap is at 1.1245 which is a dense cluster of lines including the BB 1d-Middle, the Fibonacci 23.6% one-month, the SMA 10-1d, and the Fibonacci 23.6% one-week.
All in all, a lot depends on 1.1116.
Here is how it looks on the tool:
Confluence Detector
The Confluence Detector finds exciting opportunities using Technical Confluences. The TC is a tool to locate and point out those price levels where there is a congestion of indicators, moving averages, Fibonacci levels, Pivot Points, etc. Knowing where these congestion points are located is very useful for the trader, and can be used as a basis for different strategies.
This tool assigns a certain amount of “weight” to each indicator, and this “weight” can influence adjacents price levels. These weightings mean that one price level without any indicator or moving average but under the influence of two “strongly weighted” levels accumulate more resistance than their neighbors. In these cases, the tool signals resistance in apparently empty areas.
