EUR/USD has been trading below 1.1300 amid low volatility during the US Independence Day holiday and also in anticipation to the US Non-Farm Payrolls. Its battles lines are now clear to see. If it breaks tight support or resistance it may have significant room to run.
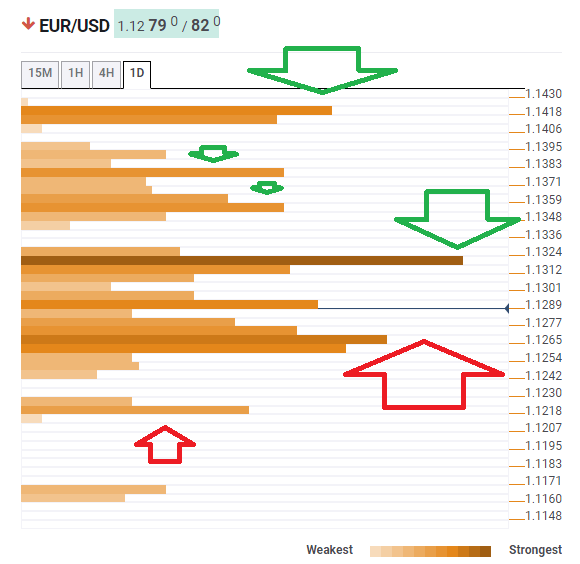
The Technical Confluences Indicator is showing that a dense cluster of resistance awaits at 1.1318 where we see the Bollinger Band 4h-Middle meeting the Fibonacci 38.2% one-month, the Simple Moving Average 100-4h, and the Pivot Point one-day Resistance 2.
If the world’s most popular currency pair breaks above this line, it faces only weak resistance at 1.1354 (SMA 50-4h and SMA 200-1d), the Bollinger Band 1d-Upper at 1.1377 but the most significant upside target is 1.1418 which is where the previous monthly high and the previous weekly high converge.
Substantial support awaits at 1.1265 where we see the confluence of the SMA 5-1d, the Pivot Point one-day Support 2, and the SMA 100-1d.
Losing that line unleashes the downside with a cushion at 1.1218 which is the convergence of the PP 1m-S1 and the SMA 50-1d.
Here is how it looks on the tool:
Confluence Detector
The Confluence Detector finds exciting opportunities using Technical Confluences. The TC is a tool to locate and point out those price levels where there is a congestion of indicators, moving averages, Fibonacci levels, Pivot Points, etc. Knowing where these congestion points are located is very useful for the trader, and can be used as a basis for different strategies.
This tool assigns a certain amount of “weight” to each indicator, and this “weight” can influence adjacents price levels. These weightings mean that one price level without any indicator or moving average but under the influence of two “strongly weighted” levels accumulate more resistance than their neighbors. In these cases, the tool signals resistance in apparently empty areas.
