- EUR/USD is maintaining a bearish trend so far.
- Further US data can provide some volatility to the market.
- Price can observe bullish reversal after the breakout of the falling wedge.
The EUR/USD outlook changed little in the short term, and it seems poised to get out from the falling wedge pattern. However, the ECB, Eurozone, and the US services and manufacturing data could be decisive this week. So, the pair seems undecided in the short term. May be the US data could bring life to this pair later today.
–Are you interested to learn about forex robots? Check our detailed guide-
The United States Building Permits are expected to increase from 1.68M to 1.69M, while the Housing Starts could jump from 1.57M to 1.59M in June. The Eurozone Current Account was reported lower at 11.7B versus 24.3B estimate compared to 22.1B in May. On the other hand, the German PPI registered a 1.3% growth, matching expectations.
EUR/USD technical outlook: Bullish reversal or bearish continuation?
The EUR/USD price is under pressure as long as it stays under the descending trendline and after registering a false breakout with great separation through the weekly pivot point of 1.1818. On the other hand, DXY’s rise after the minor decline could help Greenback take the lead again.
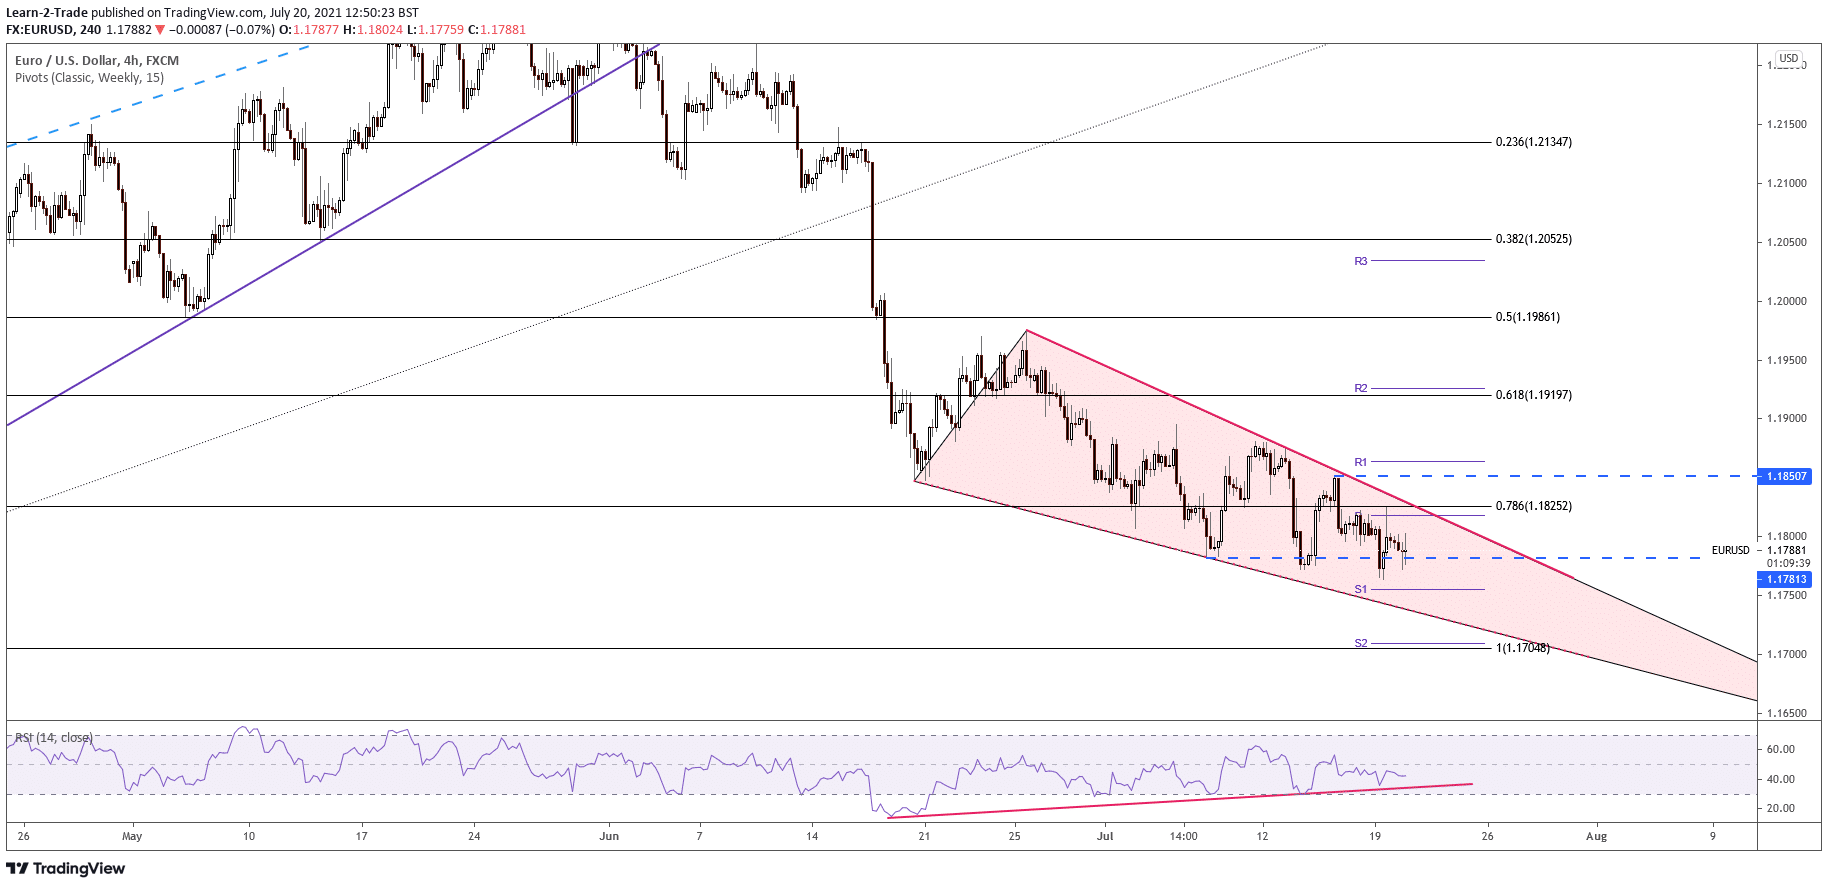
The pair is challenging the 1.1781 level again. Dropping and stabilizing under this downside obstacle could signal a deeper drop. Actually, its failure to reach and retest the down trendline indicates strong selling.
The next downside target is seen at the weekly S1 (1.1755). Also, the falling wedge’s downside line is seen as a potential obstacle, target. Technically, only a valid upside breakout could really announce an upside reversal. Escaping from the current formation and making a new higher high bring us a great buying opportunity.
–Are you interested to learn more about forex options trading? Check our detailed guide-
The falling wedge pattern is far from being confirmed. You should remember that the bias is bearish even if the RSI and the price action indicated a bullish divergence. RSI drop below the up trendline could invalidate the divergence.
It could resume its decline within the chart pattern’s body. Making a downside breakout from this pattern signals a sharp drop towards fresh new lows.
Looking to trade forex now? Invest at eToro!
67% of retail investor accounts lose money when trading CFDs with this provider. You should consider whether you can afford to take the high risk of losing your money.
