EUR/USD has been extending its gradual rise as tension mounts toward the Federal Reserve’s rate decision and as markets await news about the upcoming US tariffs on China. How is the currency pair positioned?
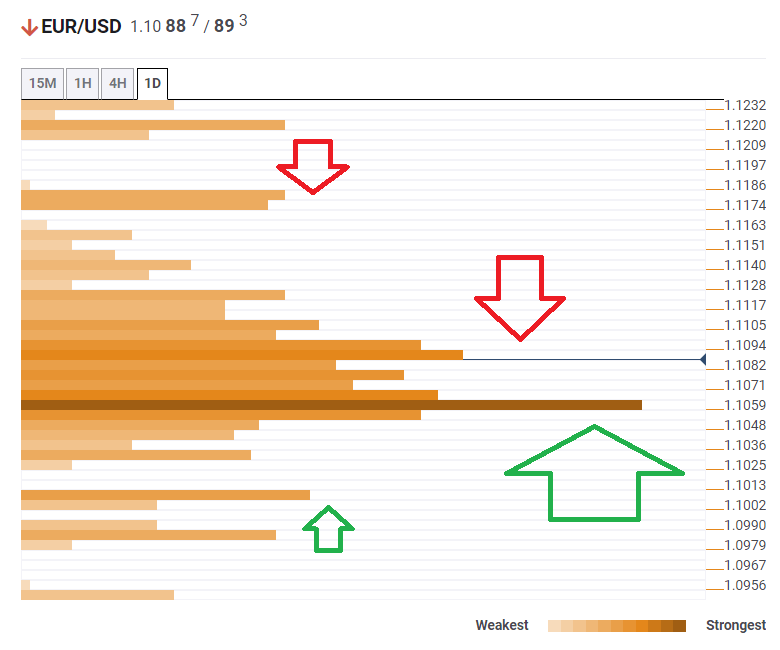
The Technical Confluences Indicator is showing that EUR/USD has significant support at 1.1059, which is the convergence of the Fibonacci 38.2% one-month, the 50-day Simple Moving Average, the Pivot Point one-day Support 2, the Bollinger Band one-day Middle, and the SMA 100-4h.
Resistance is closer but weaker. At 1.1090, EUR/USD is mired in a dense cluster of lines, including the Fibonacci 38.2% one-day, the BB 15min-Lower, the Fibonacci 23.6% one-week, the Fibonacci 23.6% one-day, the SMA 5-4h, the BB 15min-Middle, the SMA 50-15m, SMA 5-1h, and more.
Further up, 1.1180 is the upside target. It is the confluence of the PP one-week Resistance 2 and the previous month’s high.
Looking down, some support awaits at 1.1006, where the previous week’s low and the PP one-week Support 1.
Here is how it looks on the tool:
Confluence Detector
The Confluence Detector finds exciting opportunities using Technical Confluences. The TC is a tool to locate and point out those price levels where there is a congestion of indicators, moving averages, Fibonacci levels, Pivot Points, etc. Knowing where these congestion points are located is very useful for the trader, and can be used as a basis for different strategies.
This tool assigns a certain amount of “weight” to each indicator, and this “weight” can influence adjacents price levels. These weightings mean that one price level without any indicator or moving average but under the influence of two “strongly weighted” levels accumulate more resistance than their neighbors. In these cases, the tool signals resistance in apparently empty areas.
Learn more about Technical Confluence
