EUR/USD is trading above 1.1050, looking for a new direction as US-Sino tensions rise around the Senate’s bill supporting Hong Kong protesters. How is it positioned on the chart?
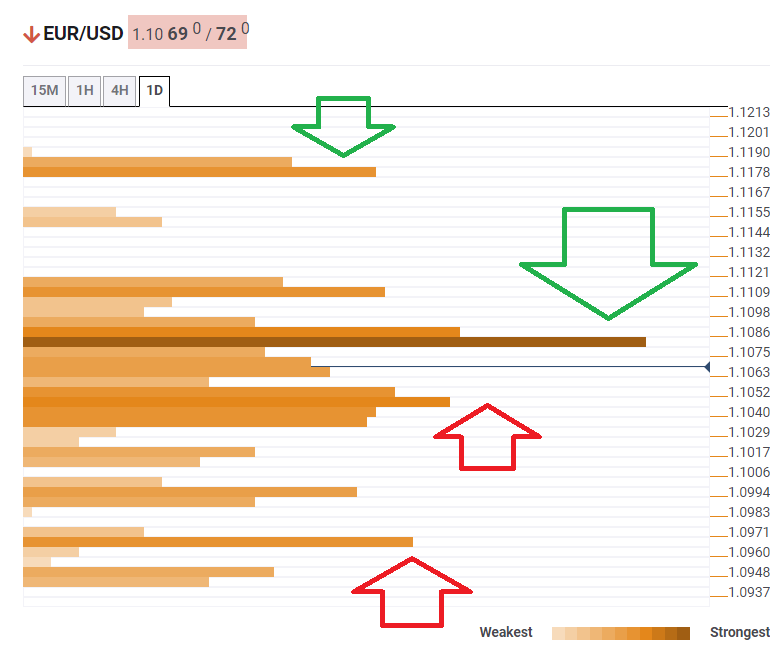
The Technical Confluences Indicator is showing that EUR/USD is capped around 1.1080, which is a dense cluster including the Simple Moving Average 10-1h, the Bollinger Band 1h-Middle, the Fibonacci 38.2% one-day, the SMA 5-4h, the Pivot Point one-week Resistance 1, the Fibonacci 23.6% one-day, the BB 1h-Upper, and the previous daily high.
Further above, the upside target is 1.1178, which is the convergence of the BB 1d-Upper, the SMA 200-1d, and the previous monthly high.
Below, support awaits at 1.1045, which is the confluence of the PP 1d-S3, the Fibonacci 23.6% one-week, the SMA 50-1d, the SMA 5-1d, the Fibonacci 161.8% one-day, and the SMA 100-1h.
Lower, 1.0965 is the meeting point between the Pivot Point one-month Support 1 and the PP 1w-S2.
Here is how it looks on the tool:
Confluence Detector
The Confluence Detector finds exciting opportunities using Technical Confluences. The TC is a tool to locate and point out those price levels where there is a congestion of indicators, moving averages, Fibonacci levels, Pivot Points, etc. Knowing where these congestion points are located is very useful for the trader, and can be used as a basis for different strategies.
This tool assigns a certain amount of “weight” to each indicator, and this “weight” can influence adjacents price levels. These weightings mean that one price level without any indicator or moving average but under the influence of two “strongly weighted” levels accumulate more resistance than their neighbors. In these cases, the tool signals resistance in apparently empty areas.
Learn more about Technical Confluence
