EUR/USD has been under pressure throughout the third quarter of the year – and the last day will likely be similar. Fierce resistance caps the world’s most popular currency pair.
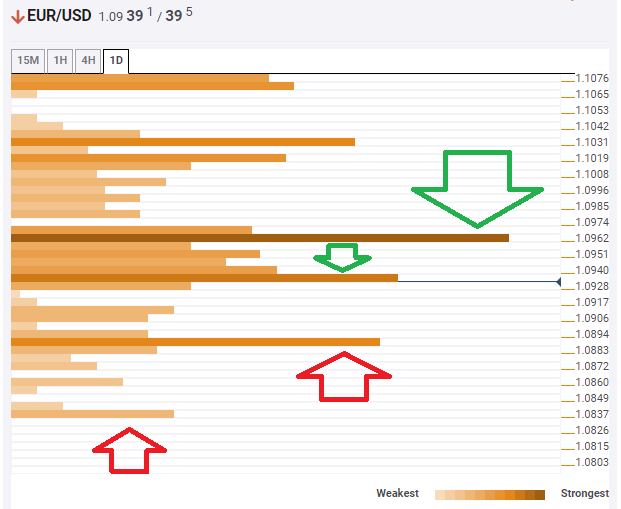
The Technical Confluences Indicator is showing that EUR/USD is struggling around 1.0935, which is the convergence of the Bollinger Band one-day Lower, BB 15-minute Lower, the Simple Moving Average 10-4 hours, the Fibonacci 23.6% one-week, the BB 15min-Middle, and more.
Stronger resistance awaits at 1.0962, which is the confluence of the previous daily high, the SMA 100-1h, and the previous monthly low.
Looking down, relatively weak support awaits at 1.0888, which is the meeting point of the Pivot Point one-month Support 1 and the PP 1w-S1.
Lower, the currency pair may target 1.0837, where the PP 1w-S2 hits the price.
All in all, resistance is stronger than support.
Here is how it looks on the tool:
Confluence Detector
The Confluence Detector finds exciting opportunities using Technical Confluences. The TC is a tool to locate and point out those price levels where there is a congestion of indicators, moving averages, Fibonacci levels, Pivot Points, etc. Knowing where these congestion points are located is very useful for the trader, and can be used as a basis for different strategies.
This tool assigns a certain amount of “weight” to each indicator, and this “weight” can influence adjacents price levels. These weightings mean that one price level without any indicator or moving average but under the influence of two “strongly weighted” levels accumulate more resistance than their neighbors. In these cases, the tool signals resistance in apparently empty areas.
Learn more about Technical Confluence
