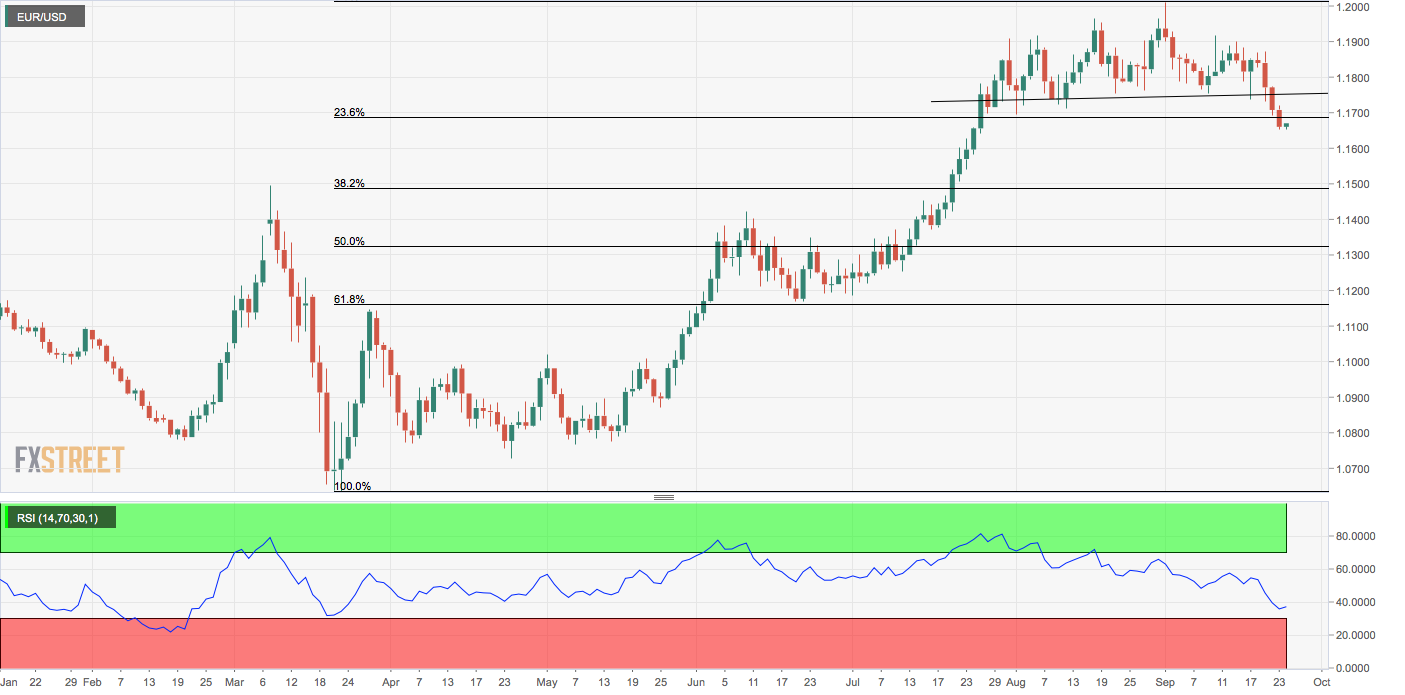
- EUR/USD closed Wednesday below 23.6% Fibonacci retracement of the March to September rally.
- The daily chart suggests scope for a decline to 1.15.
EUR/USD closed Wednesday at 1.1670, breaching the 23.6% Fibonacci retracement level of the uptrend from the March low of 1.0623 to the Sept. 1 high of 1.2011. That Fibonacci level of 1.1687 may now act as resistance.
The pair is currently trading at 1.1670 amid signs of bullish divergence of the hourly chart relative strength index. As such, the pair may challenge resistance levels at 1.1687 to 1.17, before suffering a deeper drop, as suggested by the head-and-shoulders breakdown seen on the daily chart.
The 14-day RSI, too, is reporting a bearish bias with a below-50 print.
Support levels are seen at 1.1495 (March 9 high) and 1.1486 (38.2% Fibonacci retracement).
A close above the head-and-shoulders neckline level of 1.1770 is needed to invalidate the bearish outlook.
Daily chart
Trend: Bearish
Technical levels
