- EUR/USD probes key resistance after Tuesday’s Doji candle.
- A close higher would confirm a bullish breakout on the daily chart.
EUR/USD is trading near 1.2160 at press time. That level is currently housing the neckline resistance of the inverse head-and-shoulders pattern, as seen on the daily chart.
A close higher would confirm a breakout and open the doors for a 200-pip rally (target as per the measured move method). Major resistance is located at 1.2349 (Jan. 6 high).
The pair faced rejection at 1.2180 and failed to keep gains above the neckline hurdle on Tuesday, forming an indecisive Doji candle on the daily chart. The pattern has established 1.2135 (Tuesday’s low) as the level to defend for the bulls.
A move below that could yield a re-test of 1.2023 (Feb. 17 low).
Daily chart
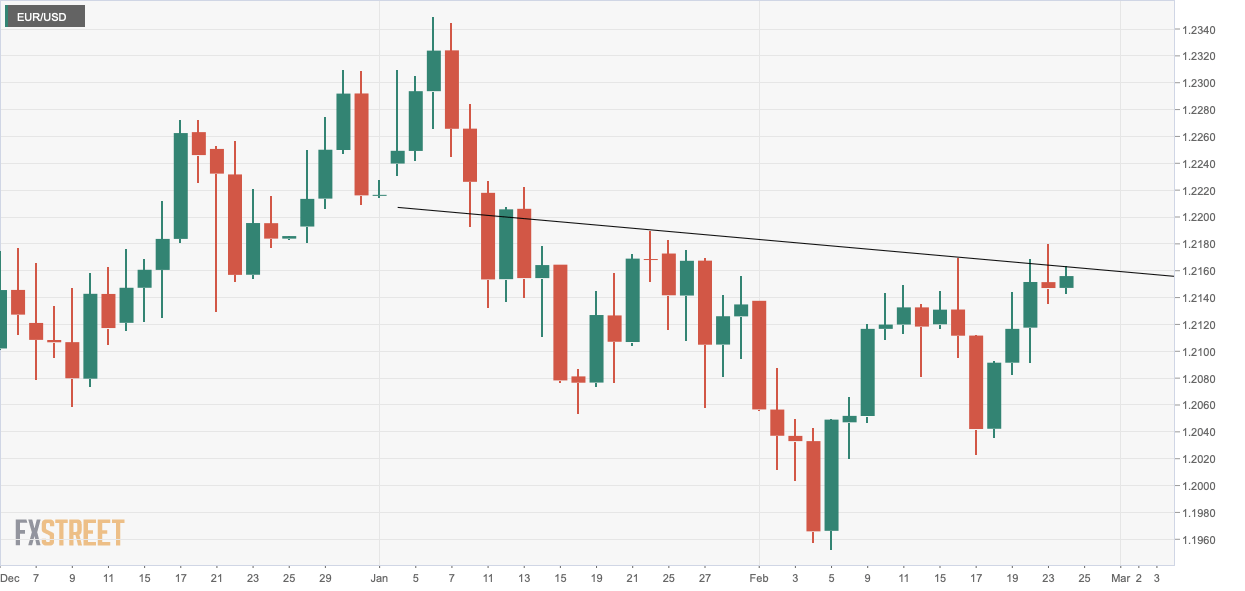
Trend: Bullish
Technical levels
