- EUR/USD bears step to the plate which reinforces the monthly resistance.
- Weekly demand area in the 1.1900 area is compelling.
The euro is in the hands of the bears following a strong surge to the upside on the longer-term time frames.
The price will likely remain in the bear’s lair in a period of distribution so long as the monthly resistance holds.
The following is a top-down analysis of the price action and market structure that arrives at a bearish bias all the way back towards the weekly support structure in the 1.19 area.
Daily chart
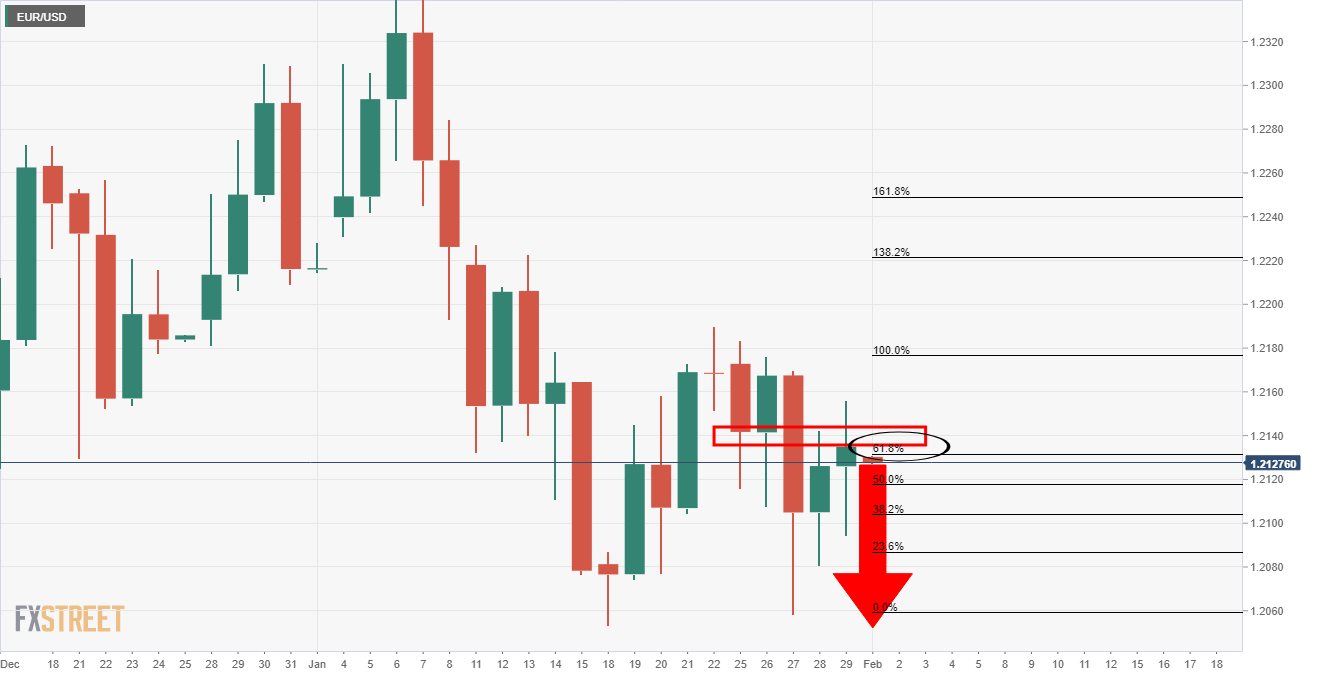
The daily chart shows that the price hit a 61.8% Fibonacci and met supply at the neckline of the M-formation, just as it did on the weekly chart below.
The thesis is bearish given the price action and resistance.
Weekly
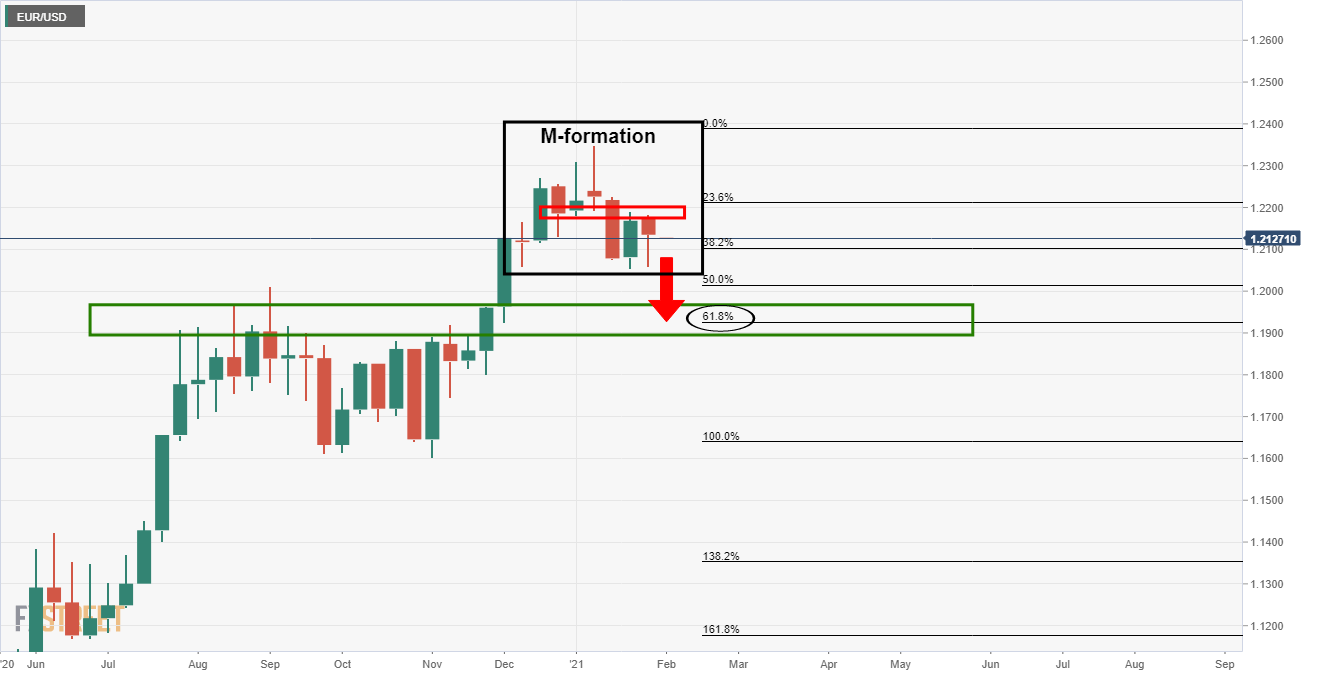
As can be seen, the price has retested the M-formations neckline and would be expected to now melt to the downside towards the next support structure.
Monthly chart

There is confluence across the board.
The monthly chart shows that the price is now in the hands of the bears in a supply area and can be expected to head back towards the 61,8% Fibonacci retracement of the monthly bullish impulse.
Bears will want to est the confluence of the last resistance that would be presumed new support.
