- EUR/USD created a Doji candle on Thursday, signaling indecision.
- Other daily chart studies continue to call a bearish move.
EUR/USD carved out a Doji candle on Thursday as it witnessed two-way business and ended the day on a flat note.
A Doji candle represents indecision. However, in this case, the candle has appeared at two-month lows. As such, one may take it to represent seller exhaustion and adopt a neutral stance.
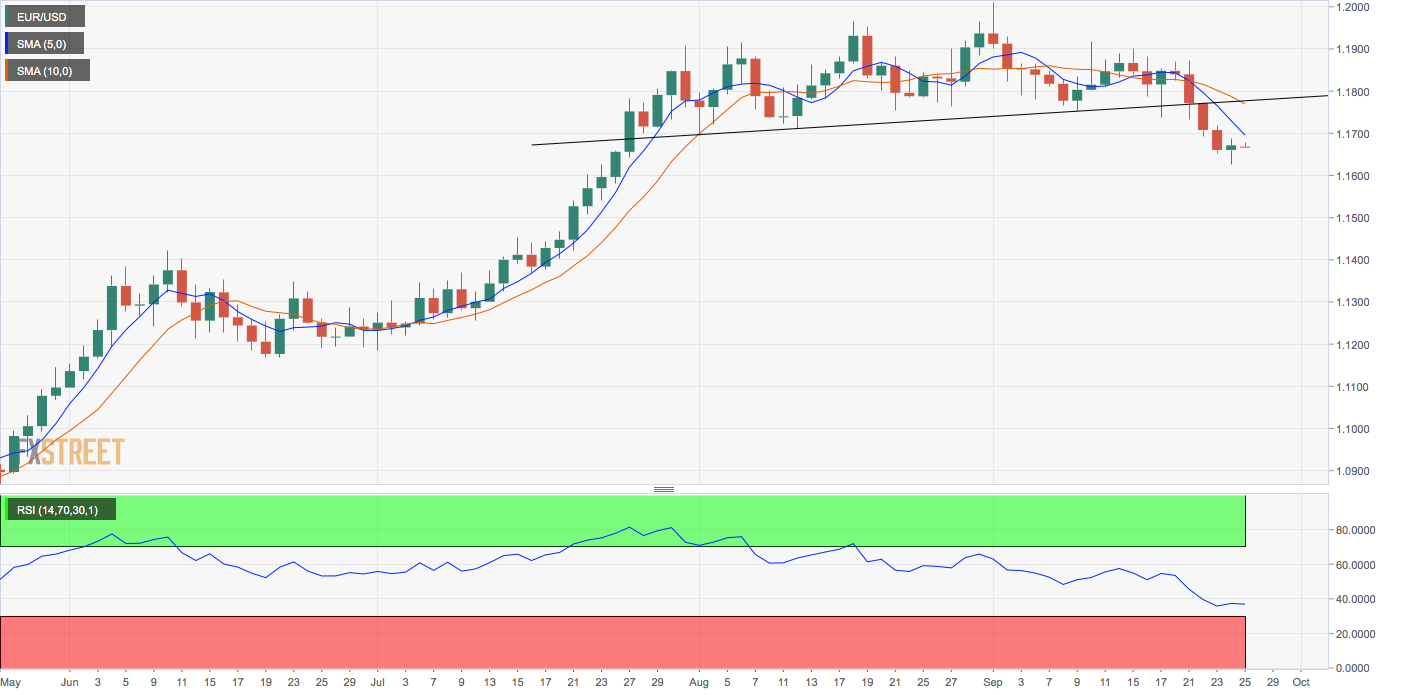
However, other chart studies remain biased bearish. For instance, the 5- and 10-day simple moving averages (SMA) continue to trend south, and the 14-day relative strength index is hovering below 50.
The head-and-shoulders breakdown confirmed earlier this week remains valid, and the pair remains below the former support-turned-resistance at 1.1696 (Aug. 3 low).
As such, the odds remain stacked in favor of deeper declines. Key support levels are located at 1.1626 (Thursday’s low) and 1.1495 (March 9 high). Meanwhile, resistance is seen at 1.1696 (Aug. 3 low) and 1.1768 (10-day SMA).
Daily chart
Trend: Bearish
Technical levels
