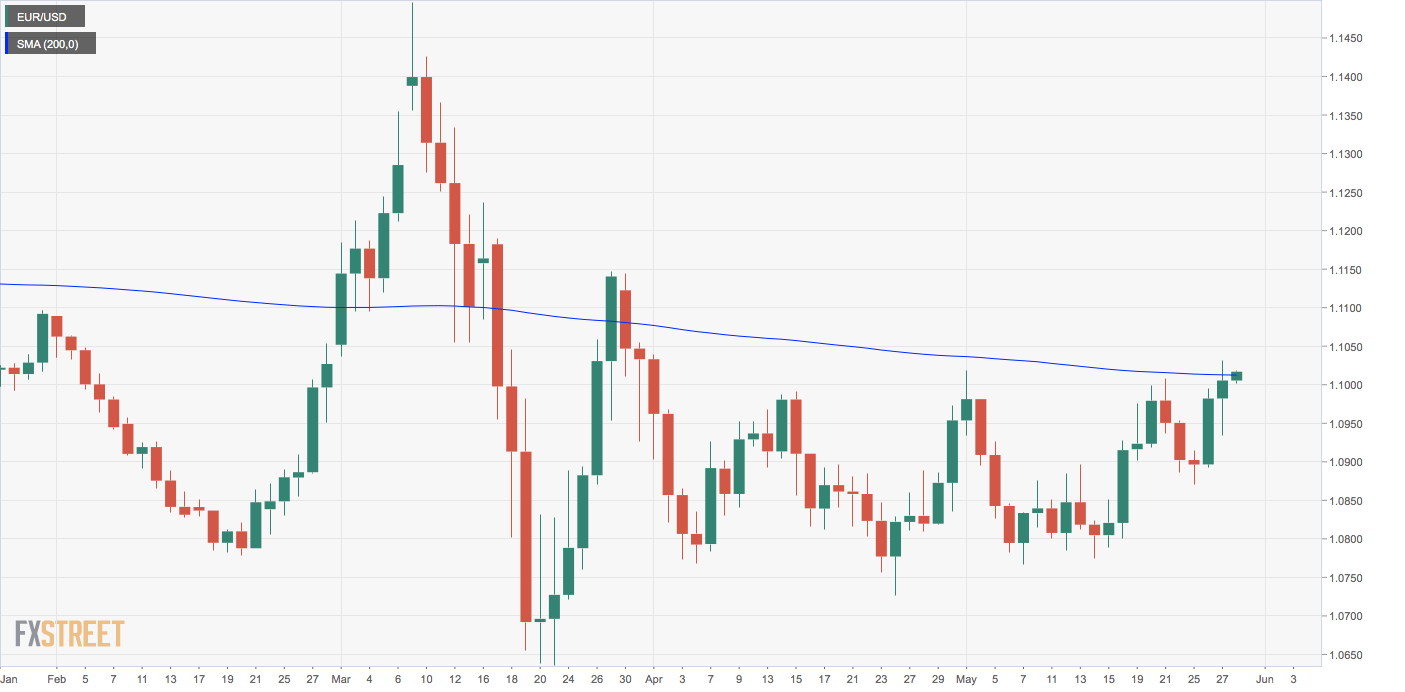
- EUR/USD peeps above the 200-day simpe moving averag, but needs to hold gains to confirm breakout.
- A daily chart indicator suggests the upward momentum is gatering steam.
EUR/USD is again looking to establish a strong foothold above the widely-tracked 200-day simple moving average (SMA), having failed to do so on Wednesday.
The pair is currently trading just above the long-term SMA hurdle at 1.1010. The average resistance was breached during Wednesday’s European trading hours. However, the breakout was short-lived, as the pair put in a high of 1.1031 only to close under the 200-day SMA.
If the pair settles above the 200-day SMA over the next few hours, more buyers could join the market, pushing the exchange rate higher to 1.1150. A violation there would expose the next psychological resistance at 1.11.
On the downside, the low of Monday’s Doji candle at 1.0870 is the level to beat for the sellers. That would shift risk in favor of a drop to the lower end of the trading range of 1.0727 to 1.1020, which has been in place since the first half of April.
The daily chart MACD histogram is printing higher bars above the zero line, a sign of strengthening of the upward momentum. So, as of writing, a convincing move above the 200-day SMA looks likely.
Daily chart
Trend: Bullish
Technical levels
