- EUR/USD has failed multiple times to keep gains above 1.09.
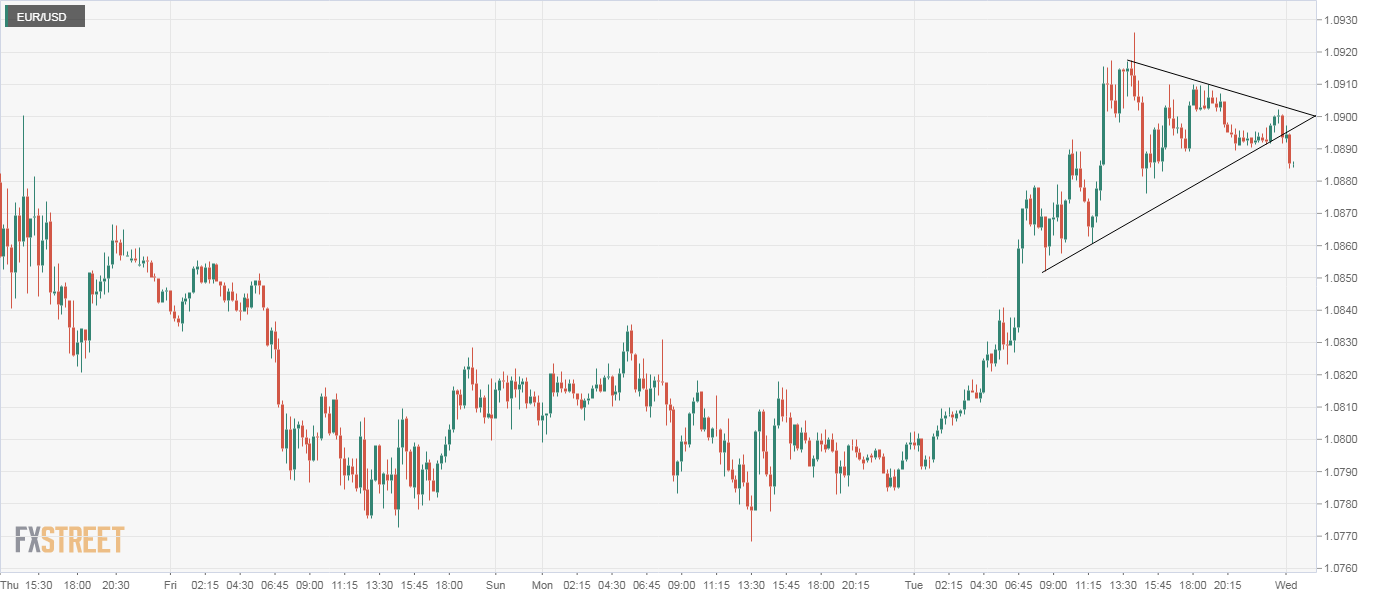
- The 15-min chart shows a symmetrical triangle breakdown.
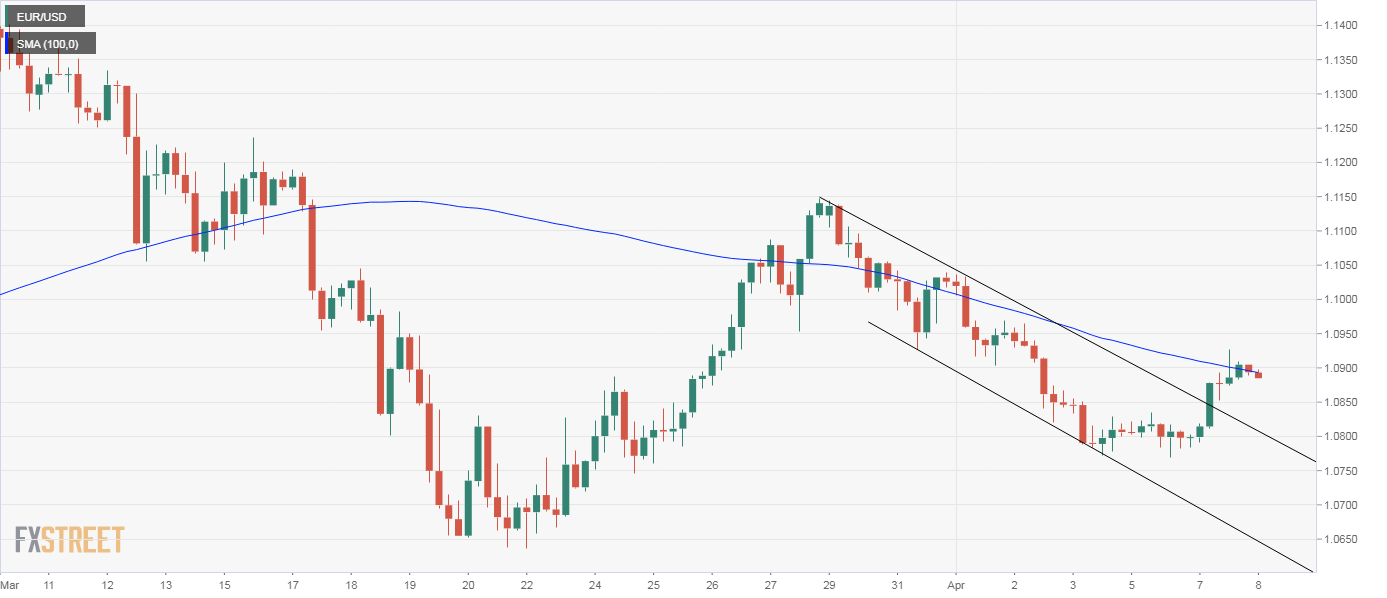
EUR/USD is feeling the pull of gravity during Wednesday’s Asian trading hours, having repeatedly failed to establish a strong foothold above the 4-hour chart 100-candle moving average during the overnight trade.
The long upper wick attached to the current 4-hour candle represents rejection at the key average hurdle at 1.09. At press time, the pair is trading near 1.0885. The previous three candles show that the pair failed to keep gains above the MA hurdle.
That, coupled with the symmetrical triangle breakdown seen on the 15-minute chart indicate scope for a deeper pullback 1.0860. Alternatively, a convincing 4-hour close above 1.09 would revive the bullish bias signaled by the falling channel breakout confirmed on Tuesday and open the doors to the psychological resistance of 1.10, which is currently housing the 4-hour chart 200-candle average.
4-hour chart
15-minute chart
Trend: Bullish above 1.09
Technical levels
