- EUR/USD retreats to 1.1735, having faced rejection above 1.19 last Thursday.
- The pair failed to keep gains above 1.19 on July 31.
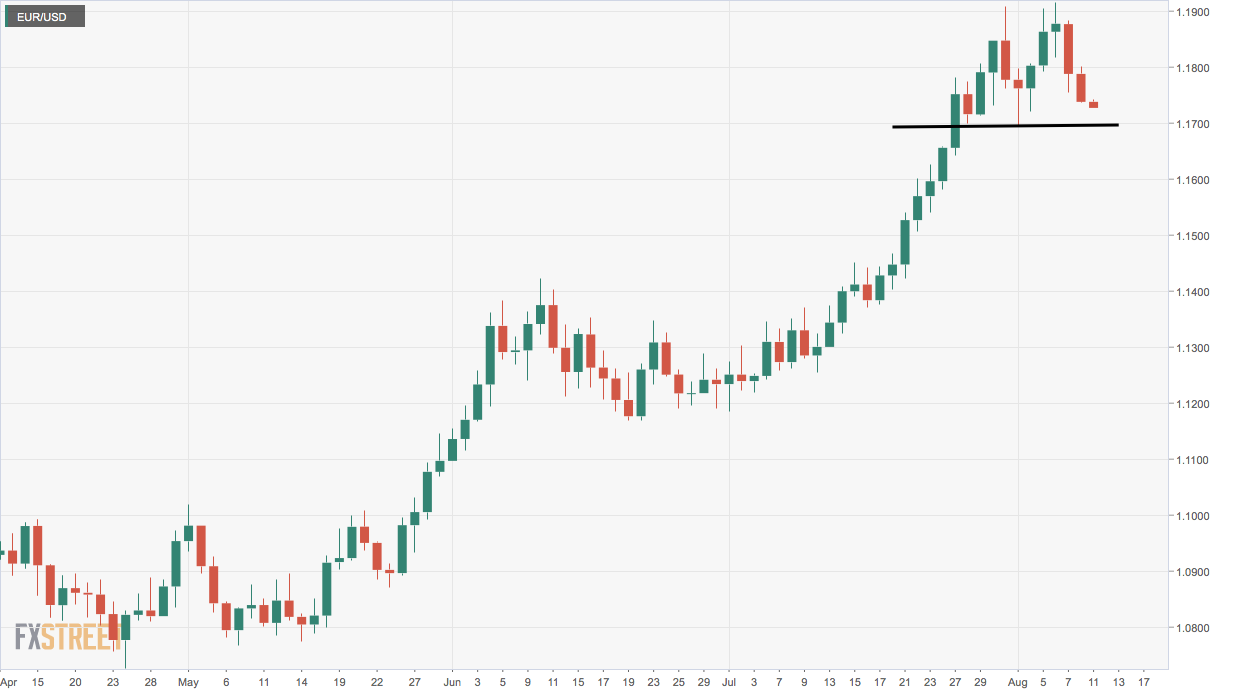
- Daily chart now shows a double top pattern with neckline at 1.1696.
EUR/USD looks to have formed a double top bearish reversal pattern on the daily chart with the neckline support at 1.1696 (Aug. 3 low).
A daily close below that level would confirm the double top breakdown and create room for a sell-off to 1.1475 (target as per the measured height method).
At press time, the pair is sidelined near 1.1735, having declined for the second straight trading day on Monday.
A move to the double top necklines support at 1.1696 looks likely with the recent candlestick arrangement signaling a bullish-to-bearish trend change and bearish divergences of the the 14-day relative strength index and the slow stochastic.
Daily chart
Trend: Bearish
Technical levels
