- EUR/USD’s downside break of a crucial rising trendline has exposed deeper support levels.
- The daily chart RSI is also aligned in favor of the bears.
EUR/USD is flashing red at press time, having dived out of an ascending trendline rising from May 14 and July 10 lows.
The violation of the four-month bullish trendline is backed by a below-50 or bearish reading on the 14-day relative strength index.,
As such, the pair looks set to test the 50-day simple moving average (SMA), currently at 1.1743. Acceptance below the major average would expose the horizontal support at 1.1696 (Aug. 3 low).
The pair is currently trading ner 1.1776, representing a 0.30% decline on the day. A close above the Sept. 10 high of 1.1918 is needed to put the bulls back into the driver’s seat.
Daily chart
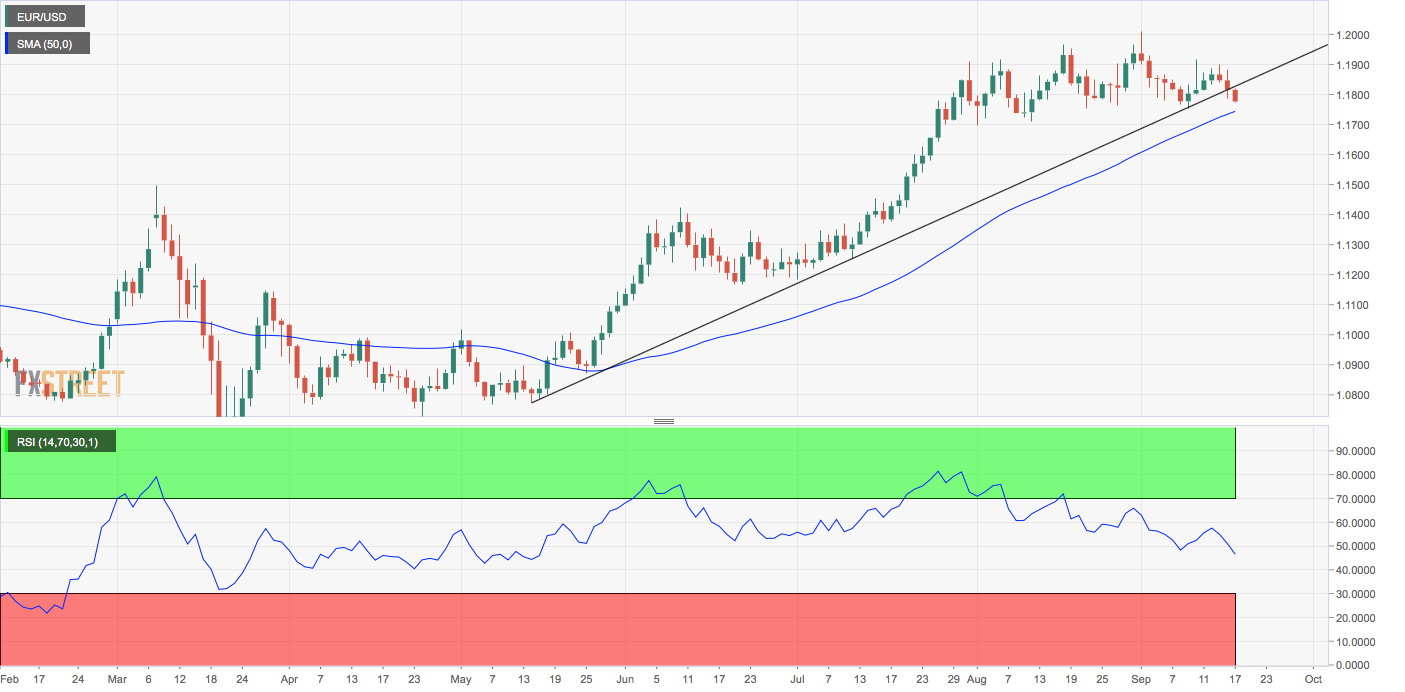
Trend: Bearish
Technical levels
