- EUR/USD’s daily chart shows an impending golden crossover.
- A similar cross seen in May 2017 had accelerated the preceding uptrend.
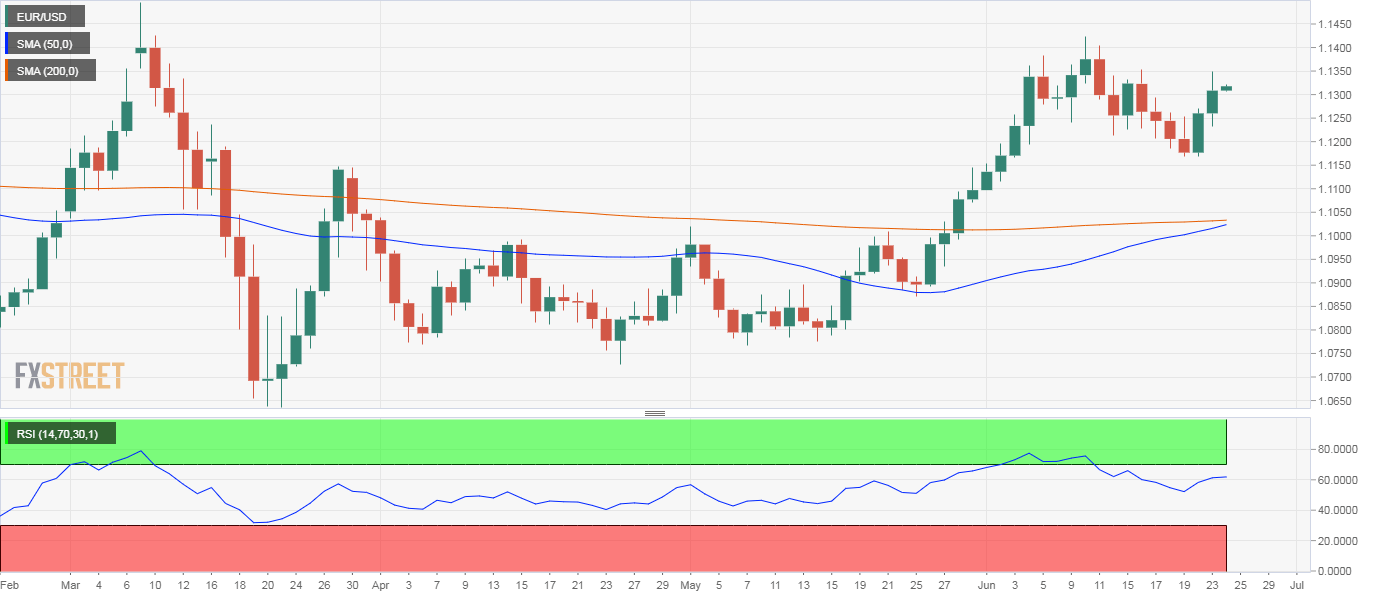
A long-term indicator is about to turn bullish for the first time in three years, EUR/USD’s daily chart shows.
The ascending 50-day simple moving average (SMA), currently at 1.01022, is on track to cross above the 200-day SMA at 1.1035. That would confirm a golden cross, an indicator of bull markets.
A similar golden cross was last seen in May 2017 when the pair was trading at 1.12, having bottomed out near 1.04 in December 2016. The confirmation of the bull cross accelerated that uptrend, which peaked above 1.125 in February 2018.
History may repeat itself, as the pair has just broken out of a falling wedge, a bullish continuation pattern. In addition, the 14-day relative strength index (RSI) is reporting bullish conditions with a below-50 print.
The golden cross often traps buyers on the wrong side of the market when the RSI is reporting overbought conditions with an above-70 print.
At press time, EUR/USD is seen at 1.1320. The immediate resistance is located at 1.1422 (June 10 high), which, if breached, would expose the March high of 1.15. The falling wedge breakout has opened the doors to 1.18 (target as per the measured move method).
On the downside, Friday’s low of 1.1168 is the level to beat for the sellers.
Daily chart
Trend: Bullish
Technical levels
