- EUR/USD’s path of least resistance appears to the downside.
- The US Treasury yields comeback to boost DXY, down EUR/USD.
- The major eyes key trendline support at 1.1749 on the 4H chart, with bearish RSI.
EUR/USD is seeing some fresh signs of life in Asia this Tuesday, although the bearish bias remains intact.
Rising inflation expectations continue to drive the US Treasury yields higher, which in turn boosts the greenback at the euro’s expense. Meanwhile, the macro-divergence between the US and Europe continues to remain a drag on the main currency pair.
From a near-term technical perspective, the spot is on the verge of forming an inverse cup and handle formation on the four-hour chart, with the pattern neckline aligned at 1.1749.
EUR/USD: Four-hour chart
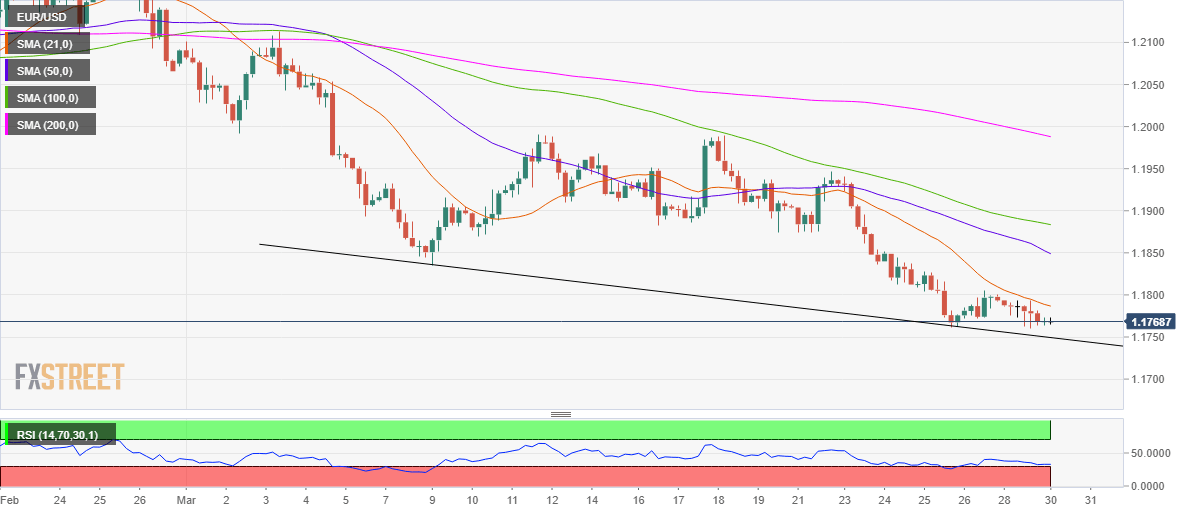
A four-hour candlestick closing below the neckline would validate the bearish formation, opening floors for a test of the 1.1700 level.
The Relative Strength Index (RSI) trades flat but holds well below the midline, suggesting that there is additional room to the downside.
Alternatively, if the powerful 1.1749 support holds, the spot could stage a solid bounce to test the bearish 21-simple moving average (SMA) at 1.1787.
The next stop for the euro bulls is envisioned at 1.1800. Further up, the downward-sloping 50-SMA at 1.1849 could be next on the buyers’ radars.
EUR/USD: Additional levels
