- EUR/USD is forming a bull flag on the 15-minute chart.
- A move above 1.1140 is needed to confirm a breakout.
EUR/USD is struggling to keep gains above 1.11 in Asia with the US dollar attracting haven bids amid increasing coronavirus fears in the US and across Europe.
So far in Asia, the pair has lacked a clear directional bias and has traded in both directions to hit a high and low of 1.1145 and 1.1089.
The rally from the March 23 low of 1.0636 would resume if the spot takes out resistance near 1.1140, confirming a bull flag on the 15-minute chart. A flag breakout is a continuation pattern, which usually accelerates the preceding upward move.
However, if the flag ends with a downside break, a bearish reversal would be confirmed and could bring a deeper decline toward1.10.
15-minute chart
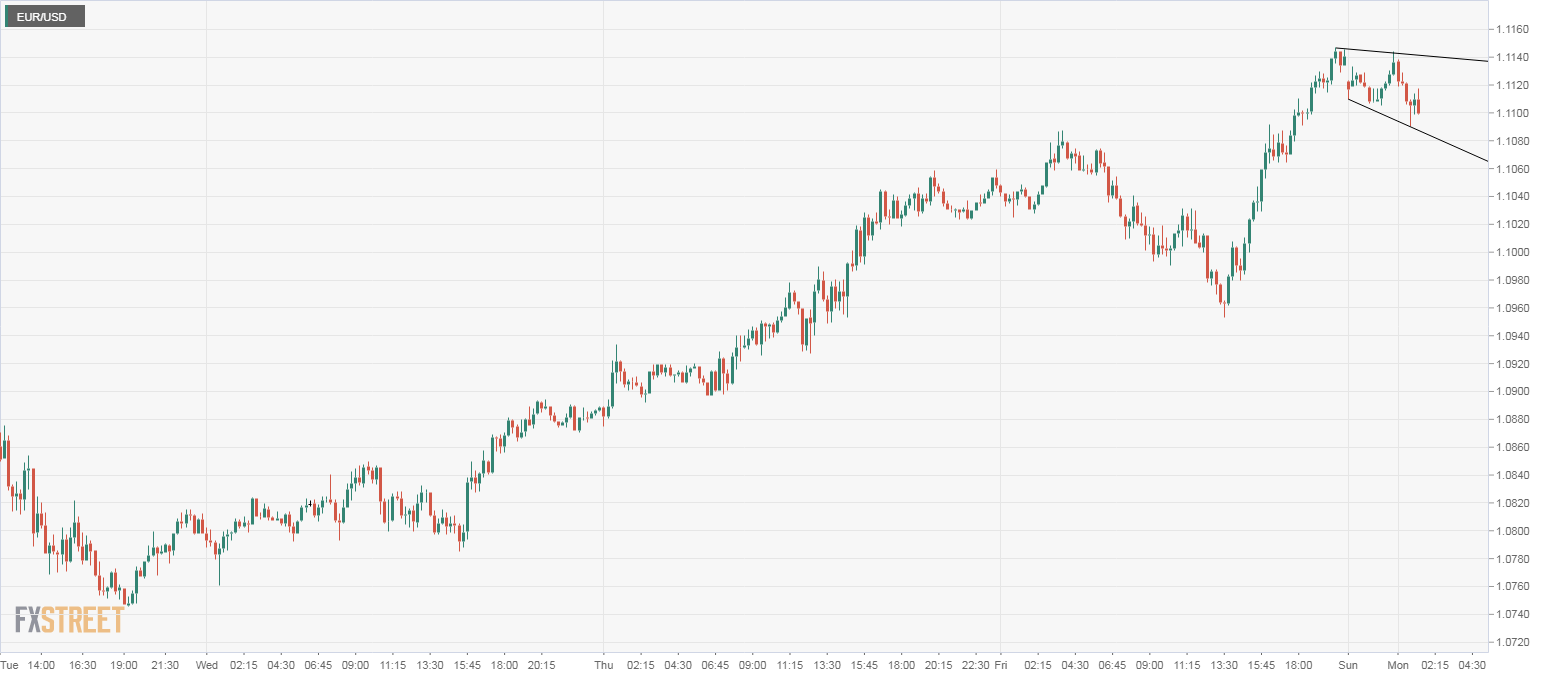
Trend: Bullish
Technical levels
