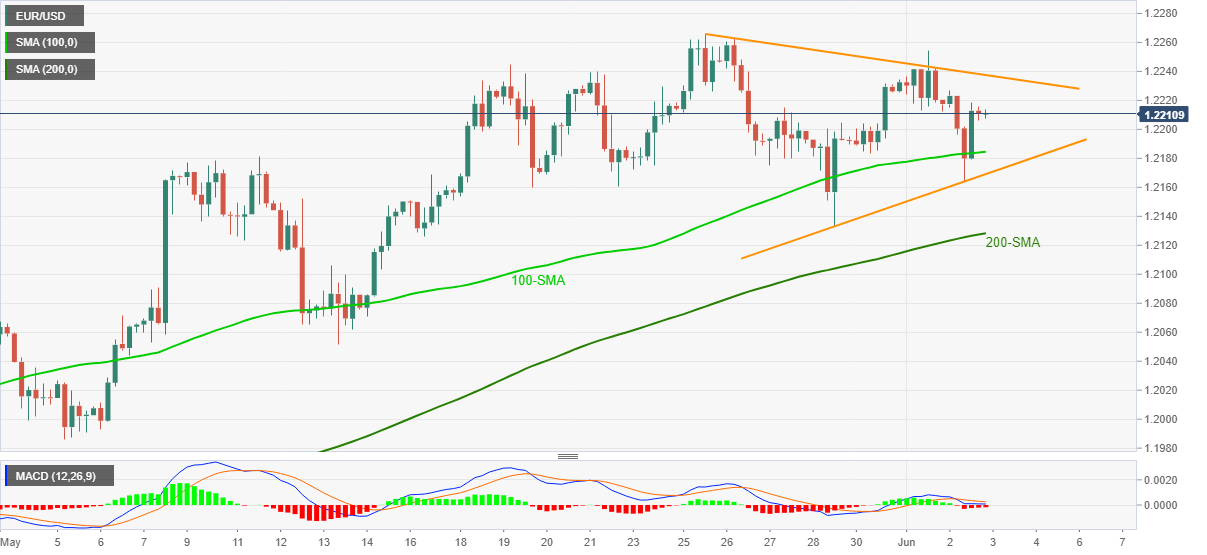
- EUR/USD seesaws inside a 10-pips trading range after bouncing off 1.2164.
- Sluggish MACD and a symmetrical triangle suggest further subdued trading.
- 200-SMA adds to the downside support, offering a tailwind to bulls.
EUR/USD wobbles in the middle of the 1.2106-2116 trading range amid a quiet Asian morning on Thursday. In doing so, the currency major pair keeps its bounce off 100-SMA while staying inside a one-week-old symmetrical triangle.
Given the sluggish MACD and a chart pattern suggesting sideways grind, EUR/USD may remain between 1.2170 and 1.2240 area comprising the triangle’s lower and upper line respectively. However, sustained trading beyond the key SMA favors the quote’s underlying bullish momentum.
Hence, buyers could initiate long positions on the successful break of 1.2240, with the initial target of May’s high near 1.2265 before aiming the 1.2300 and the yearly peak surrounding 1.2350.
On the contrary, sellers will not only need a downside break of 1.2170 but also a clear breakdown beneath the 200-SMA level of 1.2128 to regain the controls.
Following that, the mid-May low of 1.2051 and the 1.2000 threshold will gain the market’s attention.
EUR/USD four-hour chart
Trend: Sideways

