- EUR/USD’s rally looks overstretched, according to the weekly RSI.
- The indicator is showing overbought conditions for the first time in 2.5 years.
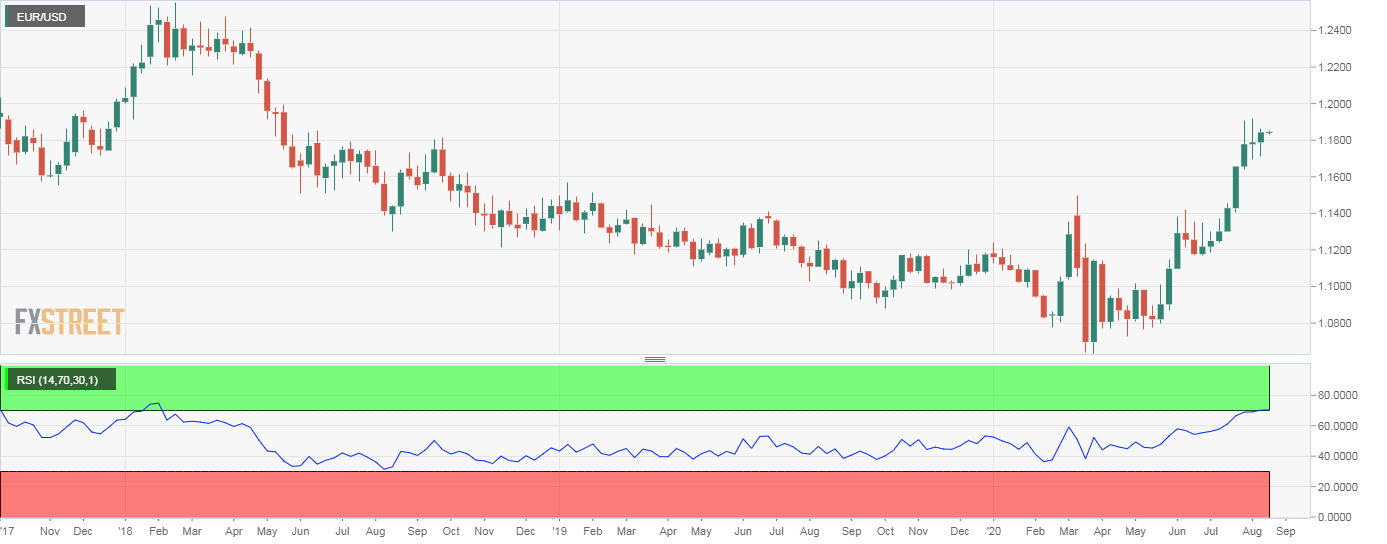
EUR/USD’s weekly chart relative strength index has crossed above 70 for the first time since January 2018. An above-70 reading represents overbought conditions.
An above-70 or overbought reading on the RSI does not imply bearish reversal but merely indicates that the rally is overstretched. In other words, there has been a significant and consistent rally in a short period of time without notable pullbacks.
As such, overbought levels on the RSI are often followed by consolidation or minor retracements.
EUR/USD is already witnessing a consolidation. The pair carved out a big Doji candle in the first week of this month, indicating buyer exhaustion. Since then, the exchange rate has been restricted well within the Doji candle’s range of 1.1696 to 1.1916.
A move below the lower end of the trading range could cause some buyers to exit the market, leading to a deeper decline to 1.1495 (March high). Alternatively, the high of 1.1916 is the level to beat for the bulls.
Weekly chart
Trend: Overbought, neutral
Technical levels
