- EUR/USD extends the previous day’s losses but stays inside short-term triangle formation.
- Bearish MACD portrays the sellers’ dominance, the further downside remains conditional on the break of the chart pattern.
- The key Fibonacci retracements add to the upside filters.
EUR/USD stretches the prior declines to 1.0890, down 0.18% on a day, during the Asian session on Thursday. Even so, the pair stays inside monthly symmetrical triangle formation while remaining below 200-bar SMA.
That said, bearish MACD signals currently push the quote towards the pattern support figures of 1.0860, a break of which could refresh the monthly low under 1.0770.
In a case the sellers keep the helm below 1.0770, 1.0700 and the previous month bottom near 1.0640 could return to the charts.
Alternatively, a 200-bar SMA level of 1.1005, followed by the triangle’s resistance around 1.1030, can keep the buyers away.
Also challenging the bulls, beyond the triangle’s upper line, will be 50% and 61.8% Fibonacci retracements of the pair’s March month downside, respectively near 1.1065/70 and 1.1170.
EUR/USD four-hour chart
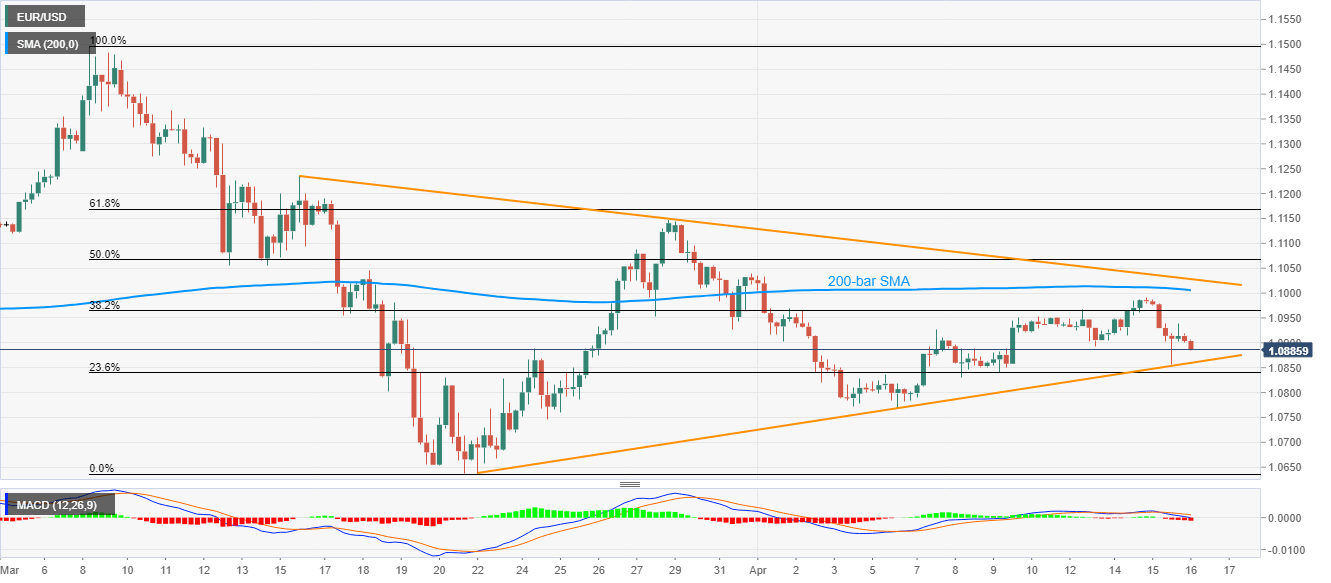
Trend: Sideways
