- EUR/USD has retraced 38.2% of the pullback from early January highs.
- The pair has trapped in a narrowing price range.
EUR/USD is trading around 1.2166, which is the 38.2% Fibonacci retracement of the decline from 1.2349 to 1.2049.
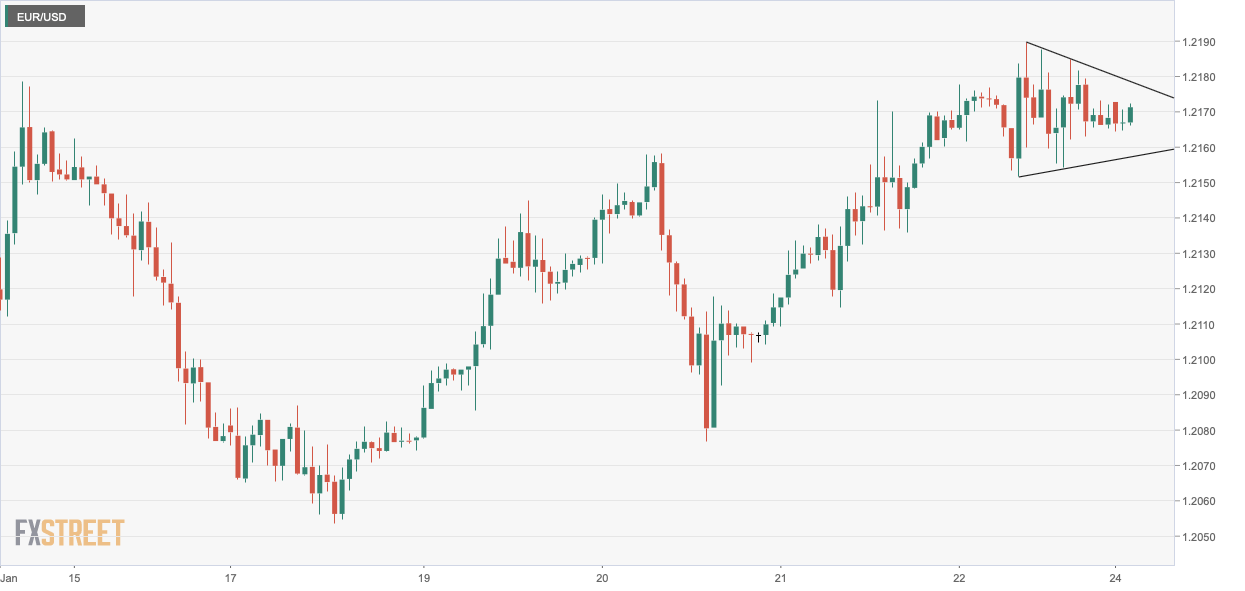
The pair has carved out a pennant pattern on the hourly chart. A breakout would validate the bullish crossover of the 50- and 200-hour Simple Moving Averages (SMA) and signal a continuation of the rally from 1.2077, opening the doors for 1.2223 (Jan. 29 high).
Alternatively, a pennant breakdown would shift risk in favor of a drop to support at 1.2120.
Hourly chart
Trend: Bullish
Technical levels
