- EUR/USD’s daily chart shows the path of least resistance is now on the higher side.
- Monday’s low is the level to beat for the bears.
EUR/USD is currently trading in a sideways manner around 1.1785.
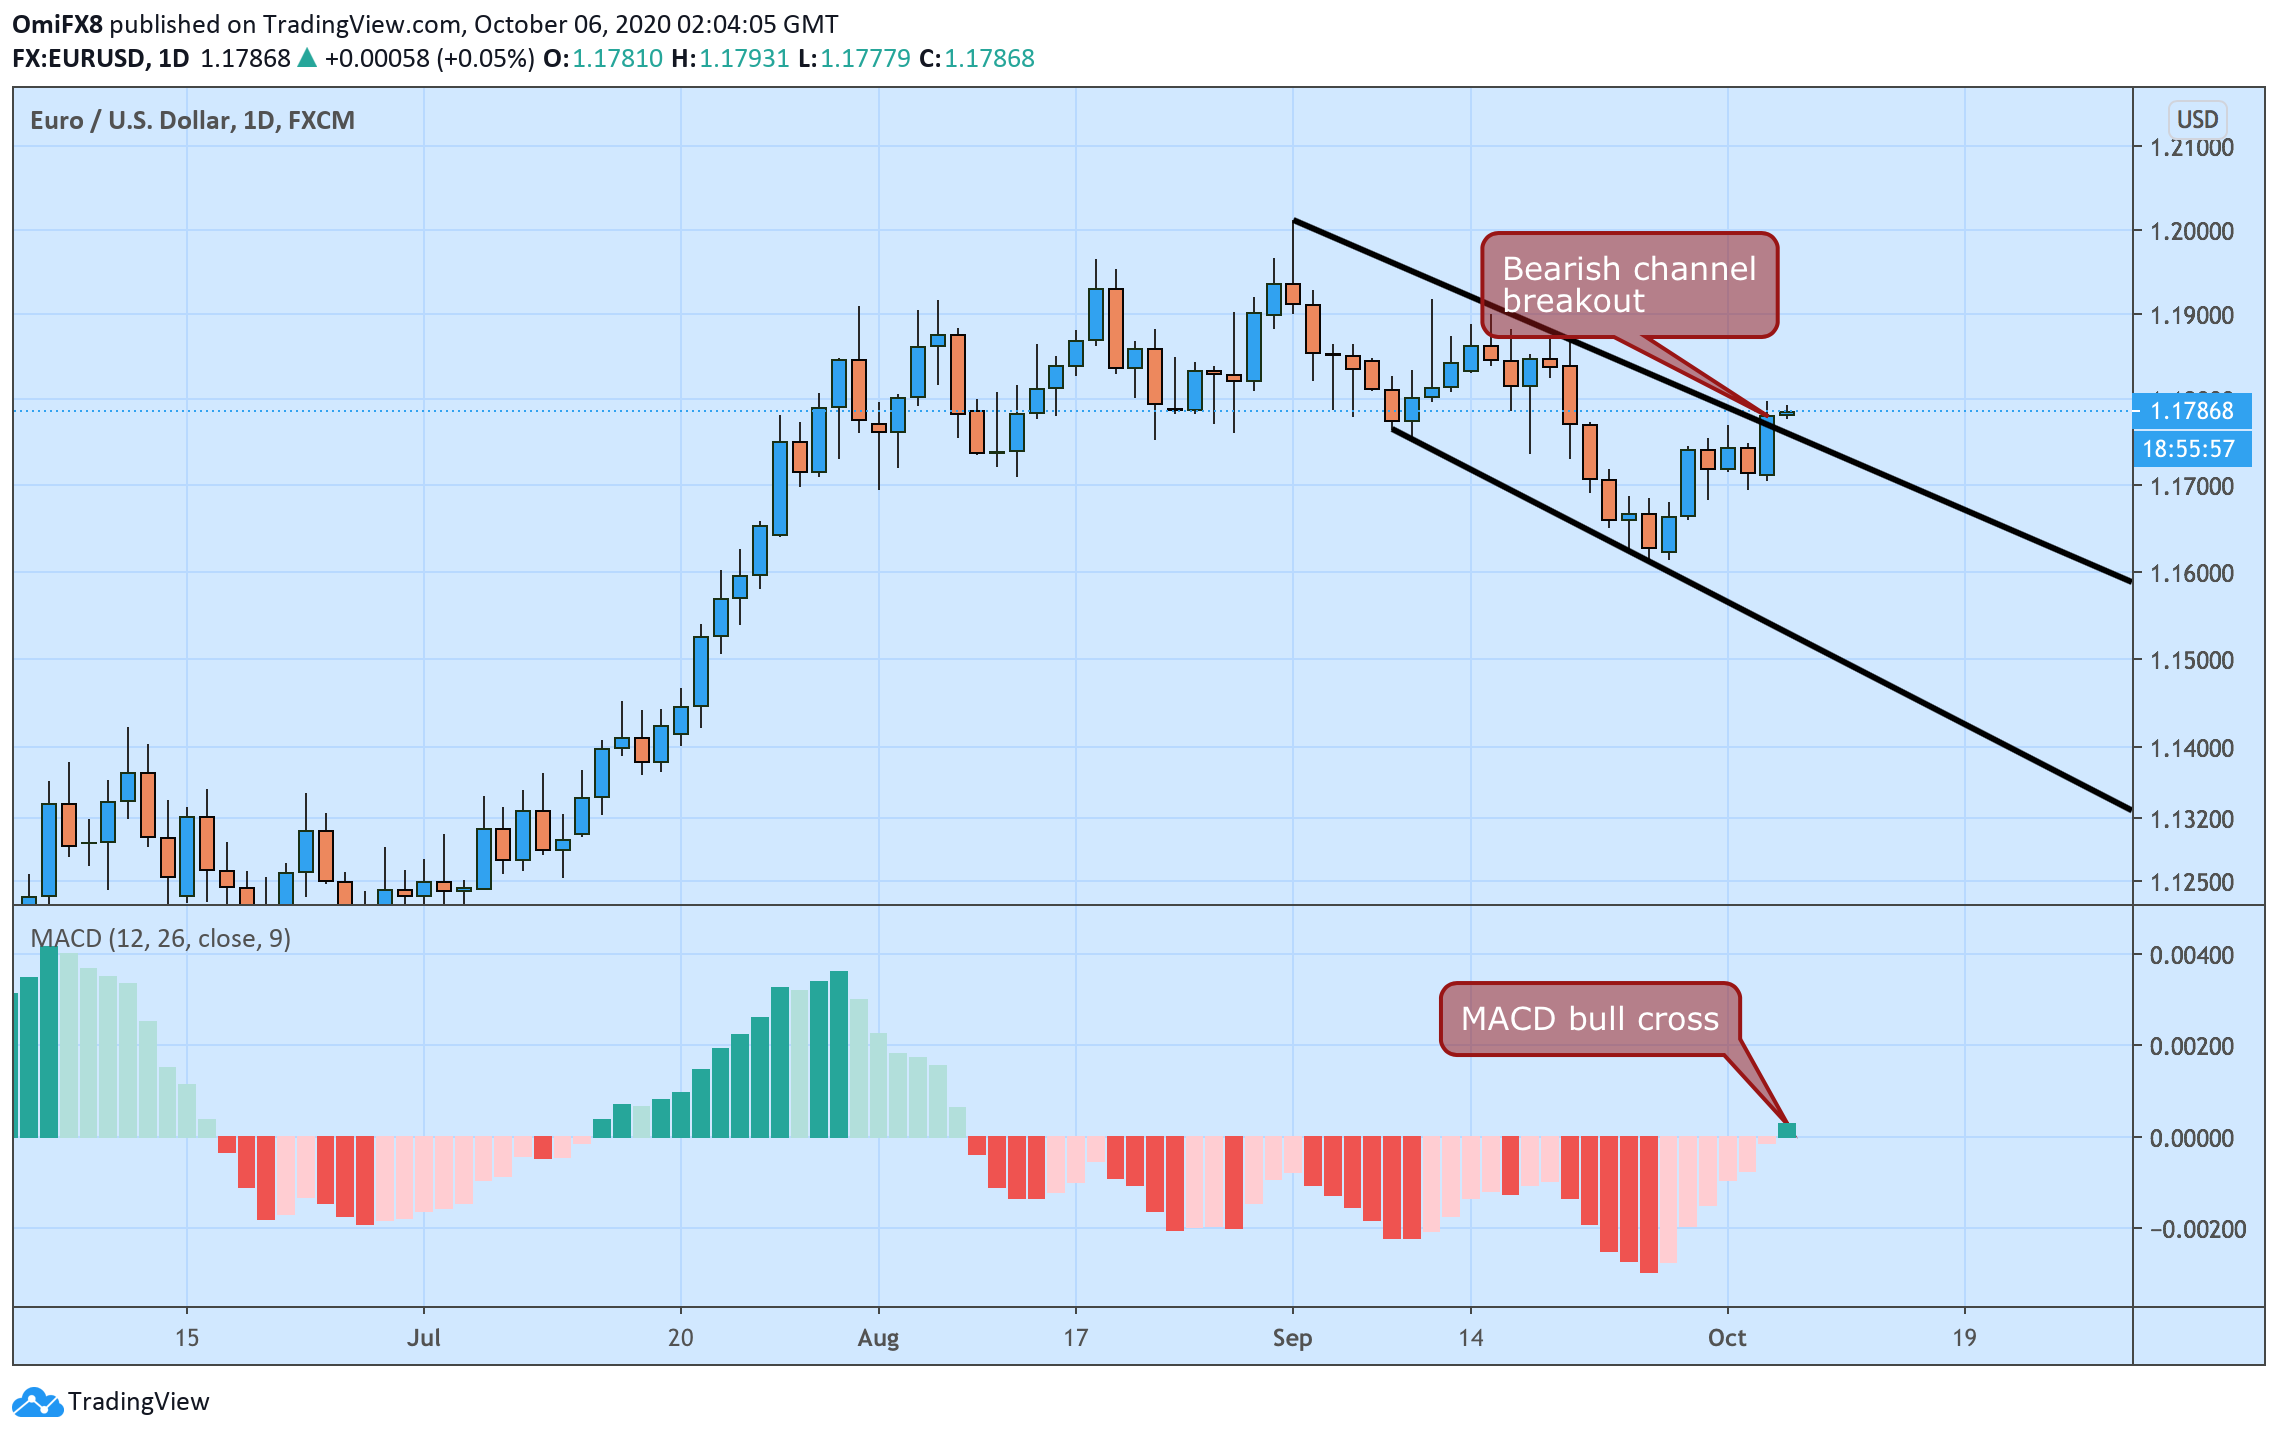
The currency pair jumped by 0.57% to 1.1781 on Monday, confirming an upside break of a falling channel, represented by trendlines connecting Sept. 1 and Sept. 21 highs and Sept. 8 and Sept. 25 lows.
The bearish channel breakout indicates the pullback from the Sept. 1 high of 1.2011 has ended, and the buyers have regained control.
Backing the breakout is the daily chart MACD histogram’s crossover above zero – a sign of bearish-to-bullish trend change.
As such, the resistance of the Sept. 10 high of 1.1918 stands exposed. So far, however, the currency pair has struggled to gather upside traction.
The bullish bias would be invalidated below Monday’s low of 1.1706.
Daily chart
Trend: Bullish
Technical levels
Resistance: 1.1802 (50-day simple moving average), 1.1918 (Sept. 10 high).
Support: 1.1706 (Monday’s low), 1.1612 (Sept. 25 low).
