- EUR/USD is extending the correction down from 2020 tops.
- US stocks are recovering after one of the worst sessions in history on Thursday.
- The level to beat for bears is the 1.1258/82 support zone.
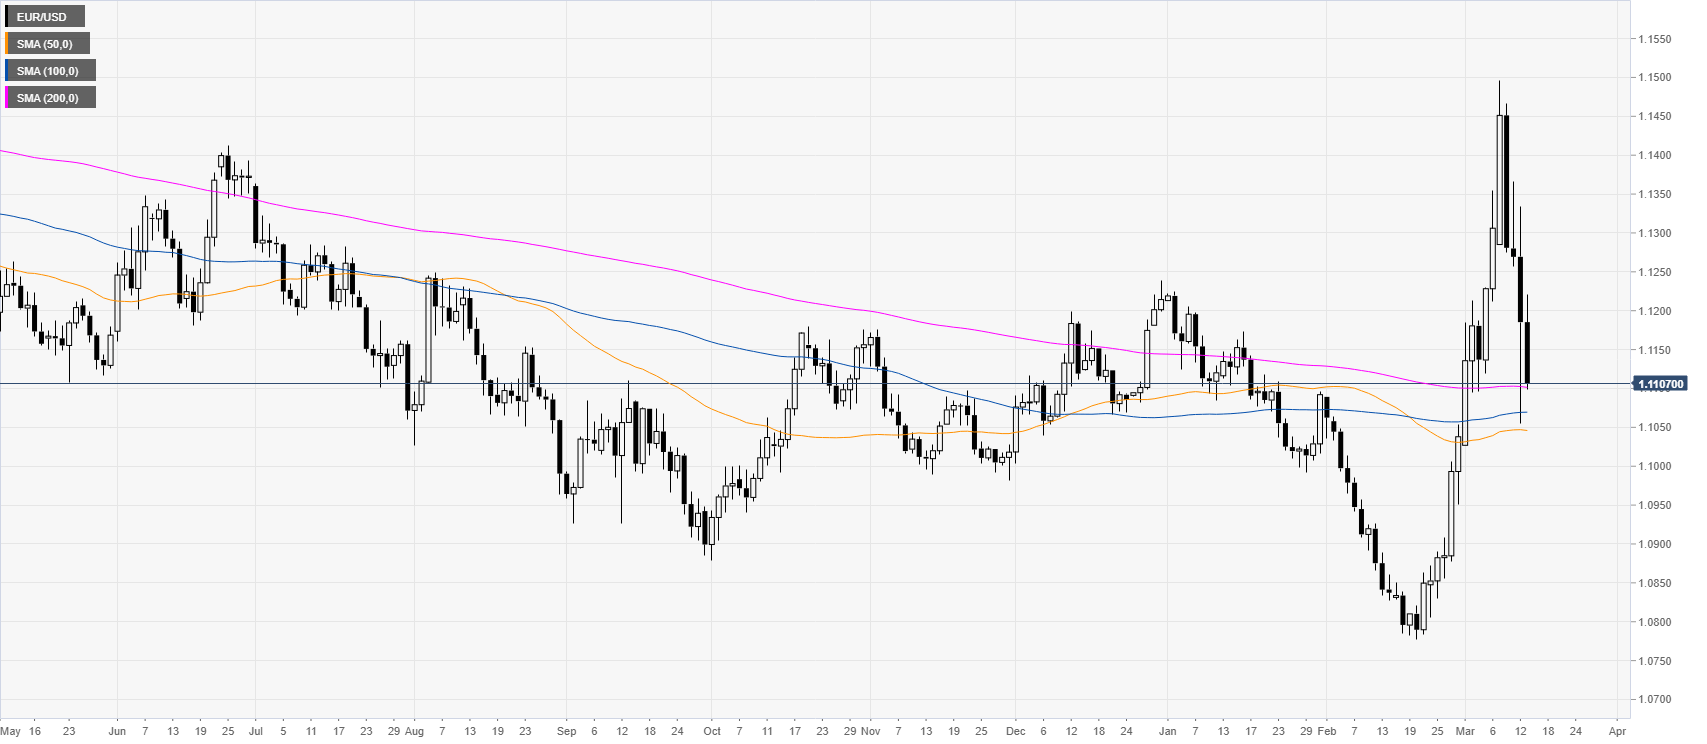
EUR/USD daily chart
EUR/USD is pulling back down from 2020 tops while trading just above the 200 SMA. The USD is up across the board following US equities rebounding after suffering one of the largest decline in history on Thursday this week.
EUR/USD four-hour chart
EUR/USD is retracing down while challenging the 1.1100 figure and the 100 SMA on the four-hour chart. The correction could extend further on a break below the 1.1100 support as the quote could then be headed towards the 1.1052 and 1.0972 levels. Resistances can be found near the 1.1156 and 1.1236 levels, according to the Technical Confluences Indicator.
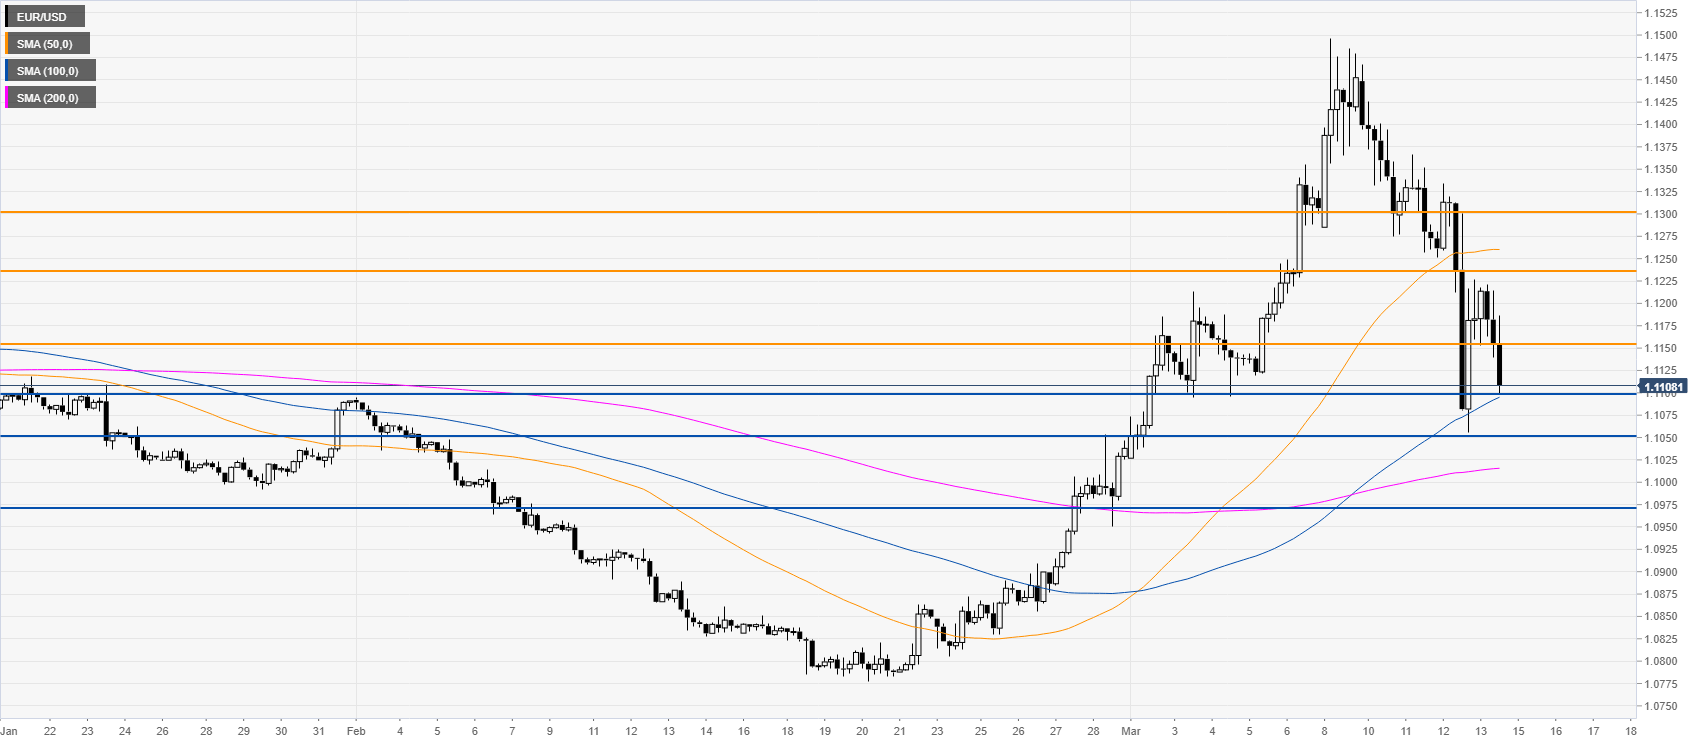
Resistance: 1.1156, 1.1236, 1.1300
Support: 1.1000, 1.1052, 1.0972
Additional key levels
