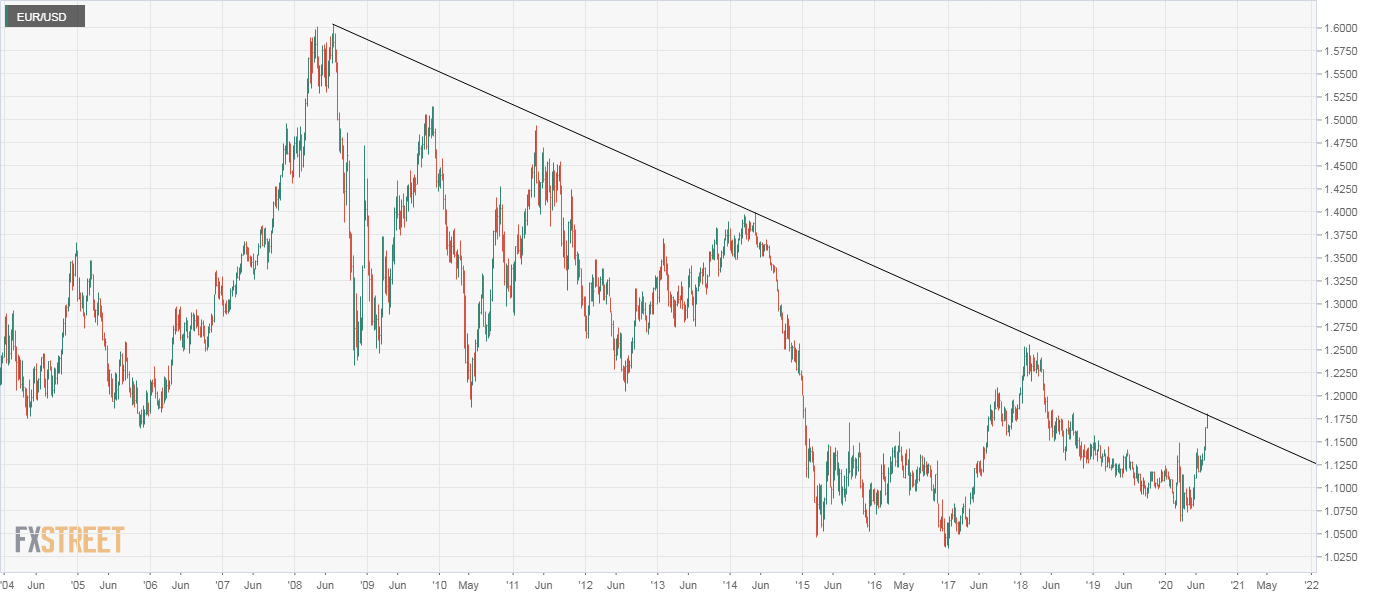
- EUR/USD probes resistance of trendline falling from 2008 highs.
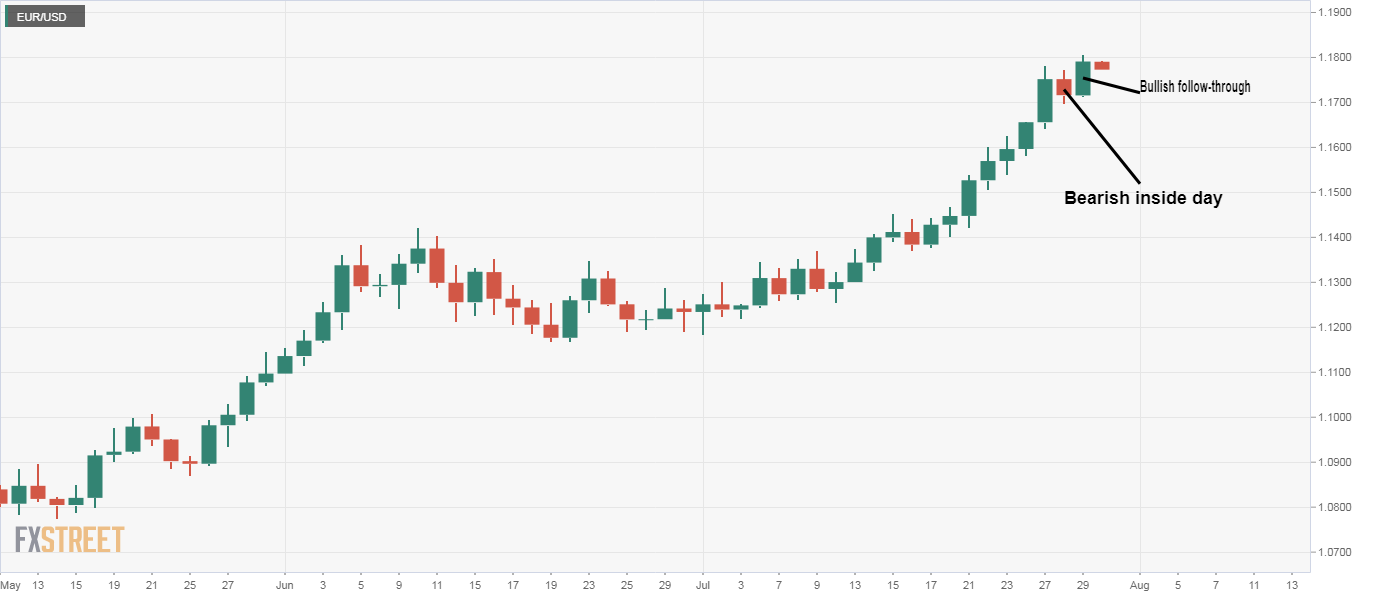
- Daily chart shows bullish sentiment is quite strong.
EUR/USD is struggling to establish a strong foothold above the trendline falling from 2008 and 2014 highs.
At press time, the resistance is located at 1.1794. The pair did rise above that level during the overnight trade, but faced rejection at 1.1807 and retreated to levels below 1.1780, where it is currently trading.
However, it is only a matter of time before the trendline hurdle is scaled in a convincing manner. This is because the daily candlestick arrangement shows sentiment is quite bullish.
The pair had formed an inside day candle on Tuesday, validating the overbought reading on the 14-day relative strength index. Inside days typically mark trend reversals. However, in this case, the follow-through to Tuesday’s inside day was bullish – the pair clocked a fresh 22-month high of 1.1806 on Wednesday and closed above Tuesday’s high of 1.1774.
What’s more, the RSI on the weekly and monthly charts continues to paint a bullish picture with an above-50 print.
If the pair succeeds in printing a close above 1.1794 on Friday, the focus would shift to the next resistance lined up at 1.20. Meanwhile, on the downside, 1.1699 (Tuesday’s low) is the level to beat for the seller. A violation there may yield a notable pullback.
Weekly chart
Daily chart
Trend: Bullish
Technical levels
