EUR/USD trades 0.11% higher on the day near 1.2058 at press time.
The hourly chart shows the pair is hovering just above the neckline resistance of an inverse head-and-shoulders (H&S) pattern on the hourly chart.
An hourly close above 1.2055 would confirm a bullish breakout and open the doors for at least a 100-pip rally to 1.2155.
On the downside, 1.20 is the level to defend for the bulls, which, if breached, will likely yield a re-test of the recent low of 1.1952.
Hourly chart
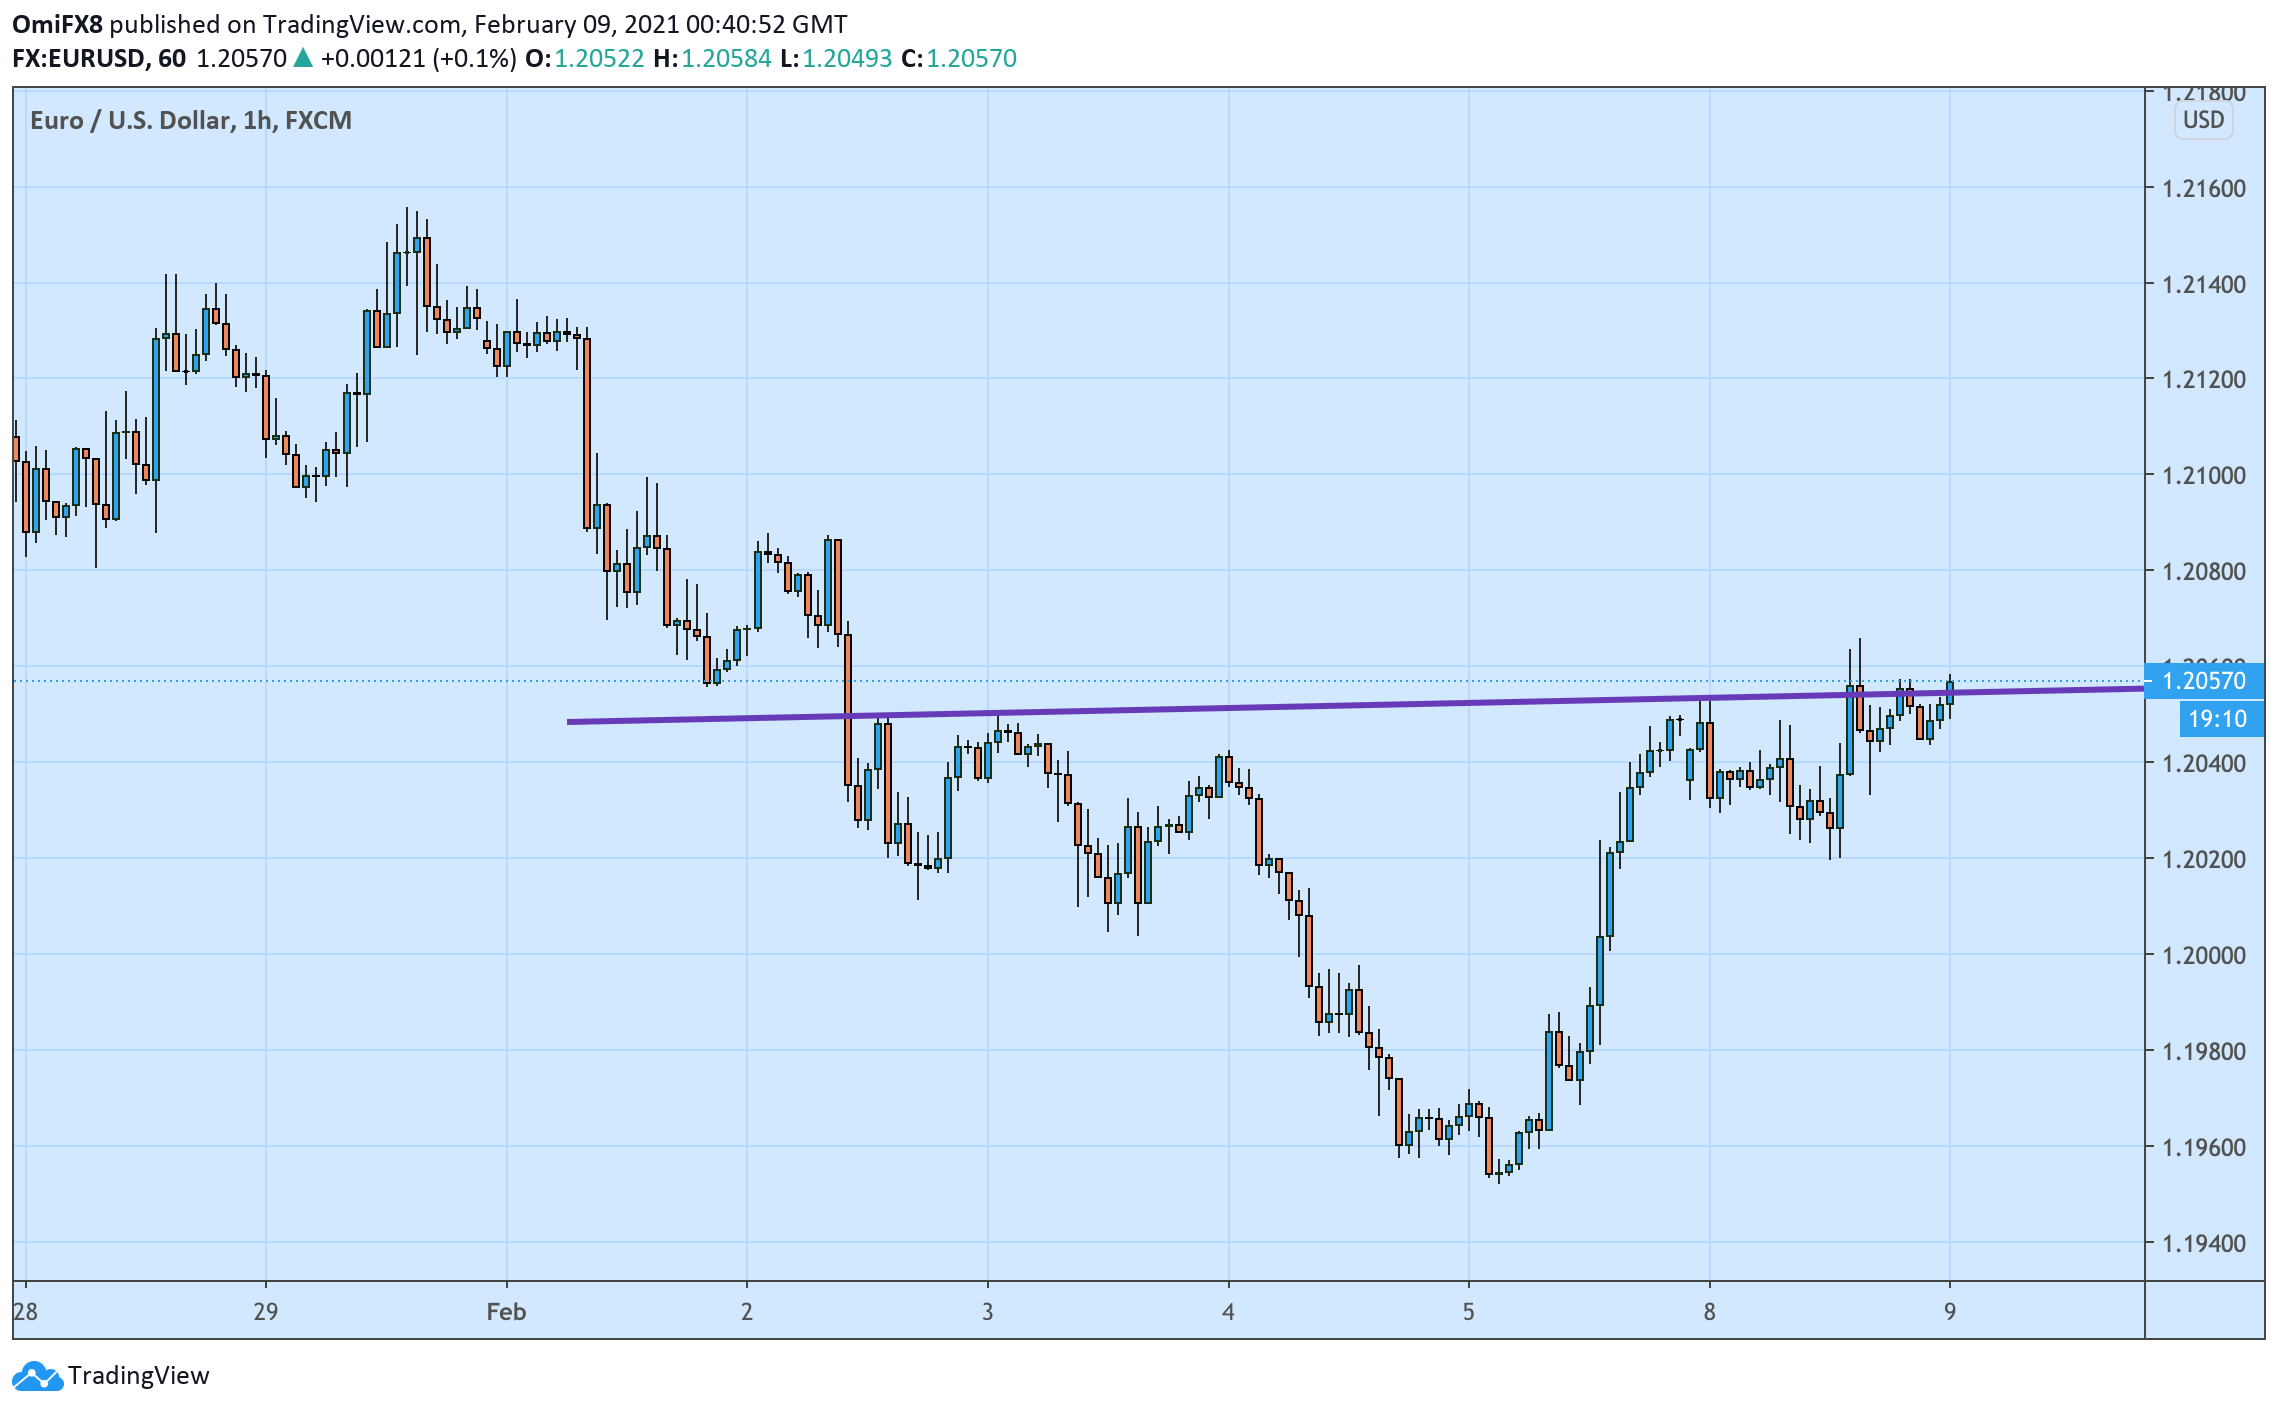
Trend: bullish
Technical levels
