- EUR/USD bulls struggling to extend control.
- A potential symmetrical triangle in play on the 4H chart.
- Acceptance above 1.2174 is critical, as focus shifts to Fed.
EUR/USD is trying hard to extend Tuesday’s bounce above 1.2150 but in vain, as the bulls remain nervous in the run-up to the Fed showdown.
The Fed is likely to strike a dovish tone, which could further weigh down on the greenback. At the time of writing, the main currency pair trades at 1.2160, almost unchanged on the day.
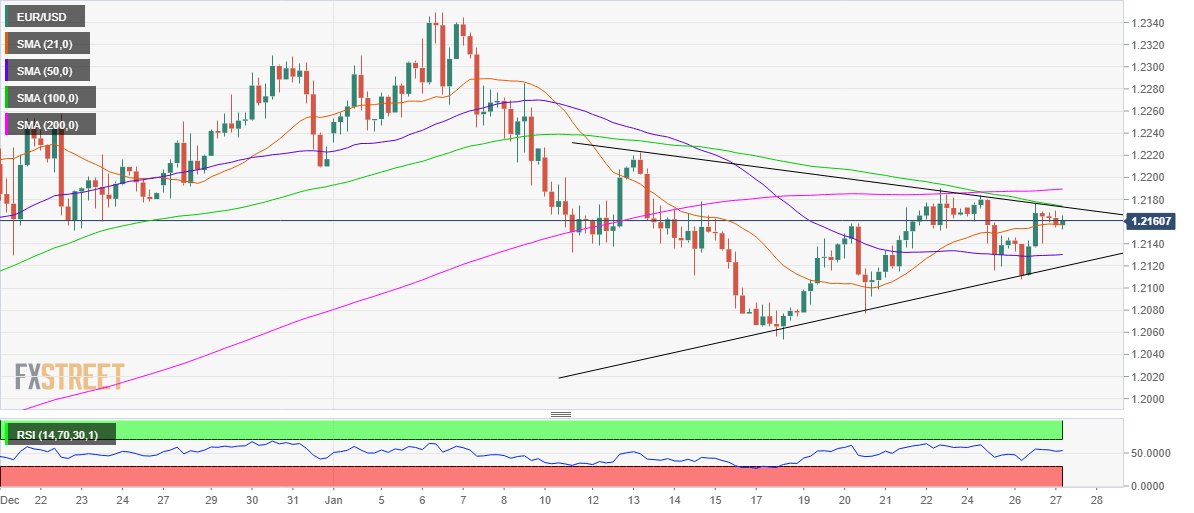
From a near-term technical perspective, the spot is hovering in the upper band of the recent trading range, having carved a potential symmetrical triangle formation on the four-hour chart.
A bullish breakout will be confirmed only if the price takes out the falling trendline (triangle) resistance at 1.2174 on a sustained basis. At that level, the 100-simple moving average (SMA) coincides.
At the moment, the euro pair is clinging onto the 21-SMA at 1.2157, awaiting a strong trading impetus. The upside break could call for a test of the 200-SMA at 1.2189, above which the 1.2200 could be probed.
Alternatively, the horizontal 50-SMA at 1.2130 would offer initial support. Further south, a breach of the rising trendline support at 1.2119 could yield a breakdown, opening floors towards January lows near mid-1.2100s.
The Relative Strength Index (RSI) points higher above the midline, suggesting that there is additional room to the upside.
EUR/USD: Four-hour chart
EUR/USD: Additional levels
