- EUR/USD picks up bids after the first negative daily closing of the week.
- Strong RSI, successful break of 50-day SMA keeps buyers hopeful.
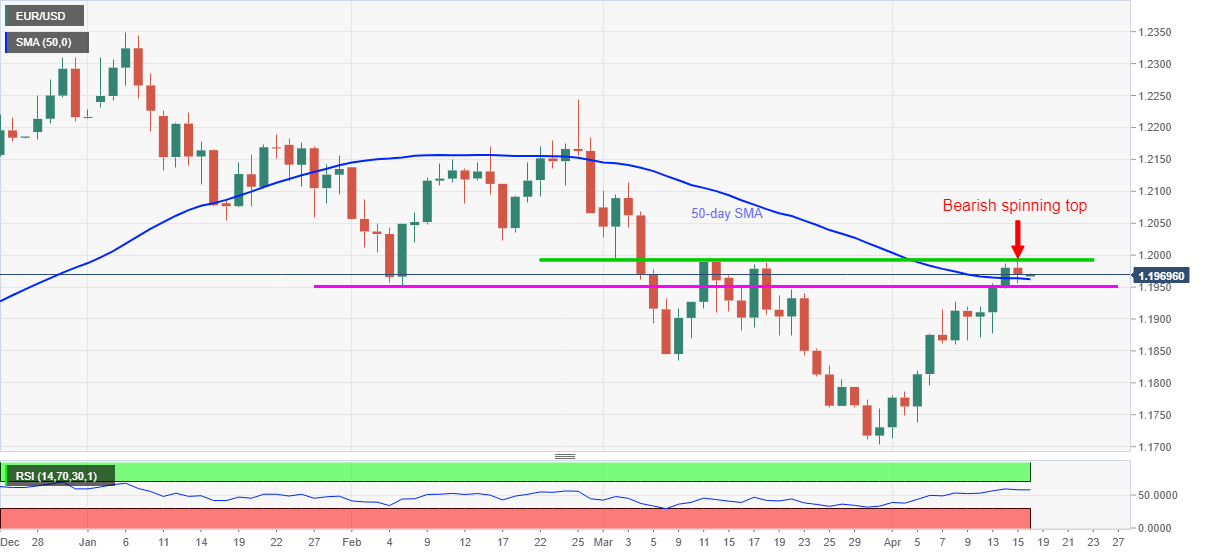
- Horizontal line from February 05 adds to the downside support, bulls will have a bumpy road beyond 1.2000.
EUR/USD licks its wounds around 1.1970, up 0.03% intraday, during Friday’s Asian session.
The currency major pair rose to the highest since March 12 before taking a U-turn from 1.1993 to snap the three-day winning streak on Thursday. In doing so, the quote portrays a bearish spinning top candlestick on the daily chart that suggests the traders’ indecision.
It’s worth mentioning that the pair’s latest pullback amplifies the strength of a horizontal area comprising multiple levels marked since March 02, which in turn probes EUR/USD bulls.
However, a daily closing above 50-day SMA and a 2.5-month-old support line, respectively around 1.1960 and 1.1950, keeps the pair sellers away.
Meanwhile, EUR/USD buyers need to provide a daily closing beyond the 1.2000 threshold to challenge the February 17 low of 1.2023 as well as March’s high around 1.2115.
Overall, the EUR/USD upside is likely to have hit the wall of resistance and the bearish candlestick formation adds to the buyers’ worries.
EUR/USD daily chart
Trend: Pullback expected
