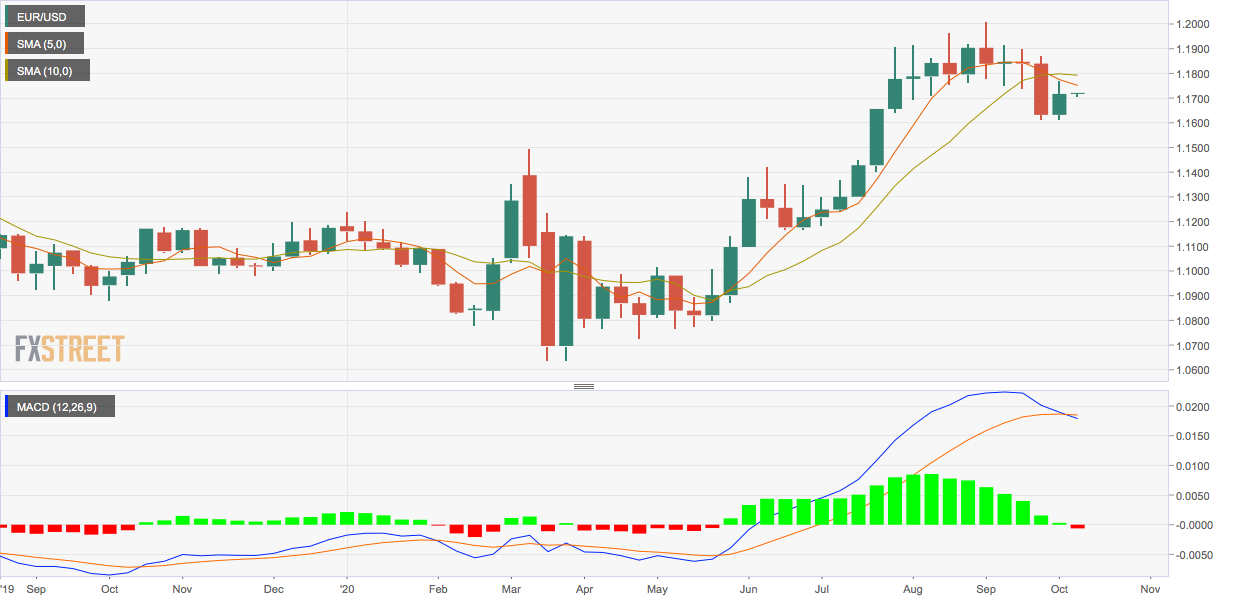
- EUR/USD’s weekly MACD shows a bullish-to-bearish trend change.
- While the pair bounced last week, it is not out of the woods yet.
EUR/USD jumped 0.74% last week, trimming the previous week’s 1.77% decline.
However, the currency pair is not out of the woods yet, as a widely-tracked longer duration technical indicator has flipped bearish for the first time since May.
The MACD histogram, an indicator used to identify trend changes and trend strength, has crossed below zero for the first time in six months, indicating a bearish reversal.
The 5- and 10-week simple moving averages have also produced a bearish crossover.
As such, a re-test of the recent low of 1.1612 cannot be ruled out. A violation there would expose 1.1495 (March 9 high).
On the higher side, the 50-day SMA at 1.18 is the level to beat for the bulls, followed by 1.1918 (Sept. 10 high). The pair is currently trading largely unchanged on the day at 1.1720.
Weekly chart
Trend: Bearish
Technical levels

