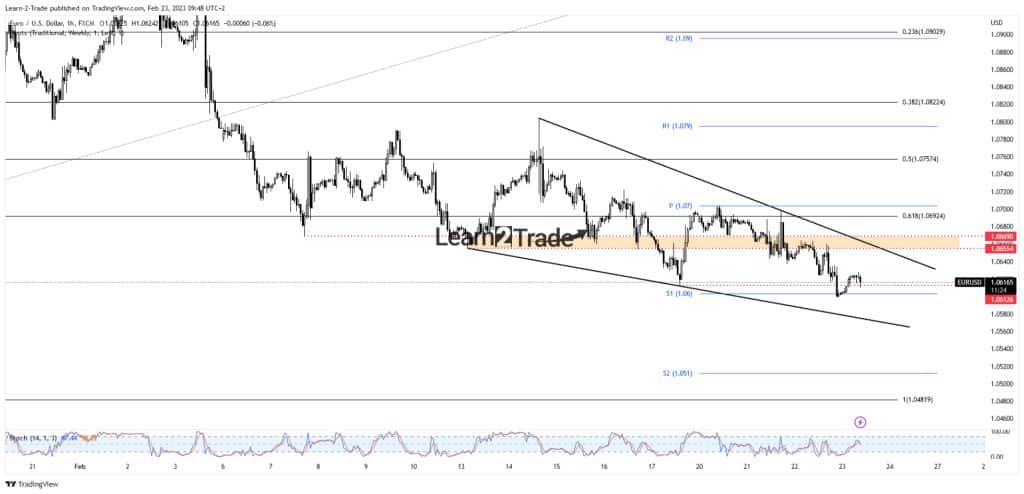
- The bias is bearish. The US Prelim GDP could be decisive today.
- The Falling Wedge pattern is far from being confirmed.
- Breaking below 61.8% signaled a downside reversal.
The EUR/USD price extended its downside movement on Thursday during the London session. The pair is now trading at 1.0616, above yesterday’s low of 1.0598.
–Are you interested in learning more about STP brokers? Check our detailed guide-
The Flash Services PMI on Tuesday supported the greenback. The indicator jumped from 46.8 points to 50.5 points, far above the 47.3 expected confirming expansion. Yesterday, the FOMC Meeting Minutes lifted the USD as well.
As expected, the Federal Reserve signaled further hikes in the next monetary policy meetings. The Federal Funds Rate was increased by 25-bps in the February meetings even though a few officials wanted a 50-bps hike. The US reported higher inflation in January compared to December. Higher inflation reported in February could force the FED to deliver a 50-bps hike again.
Today, the Prelim GDP is seen as a high-impact event and is expected to report a 2.9% growth. In addition, Unemployment Claims could increase from 194K to 200K in the last week, while Prelim GDP Price Index may report a 3.5% growth.
The US will release the Core PCE Price Index, New Home Sales, Revised UoM Consumer Sentiment, Personal Income, and Personal Spending tomorrow.
EUR/USD price technical analysis: Bearish bias
Technically, the price extended its downside movement after testing the broken 61.8% (1.0692) retracement level. Dropping and stabilizing below this downside obstacle signaled a downside continuation and potential reversal.
–Are you interested in learning more about making money with forex? Check our detailed guide-
The downtrend line and 1.0655 – 1.0669 represent upside obstacles. Now, it challenges the 1.0610 and the weekly S1 (1.0600). Technically, the price action developed a Falling Wedge, which could represent a bullish formation. Still, it’s premature to talk about this scenario as the chart pattern is far from confirmed.
Taking out the S1 (1.0600) activates more declines toward the pattern’s downside line. Still, a larger drop towards the S2 (1.0510) and down to 1.0481 could be validated by a valid breakdown below the downside line.
Looking to trade forex now? Invest at eToro!
68% of retail investor accounts lose money when trading CFDs with this provider. You should consider whether you can afford to take the high risk of losing your money

