EUR/USD was hit hard by the dovish shift in the ECB’s decision to push back on rate hikes and provide new funding for banks. President Mario Draghi’s dovish press conference did not help and the pair the lowest since June 2017. What’s next?
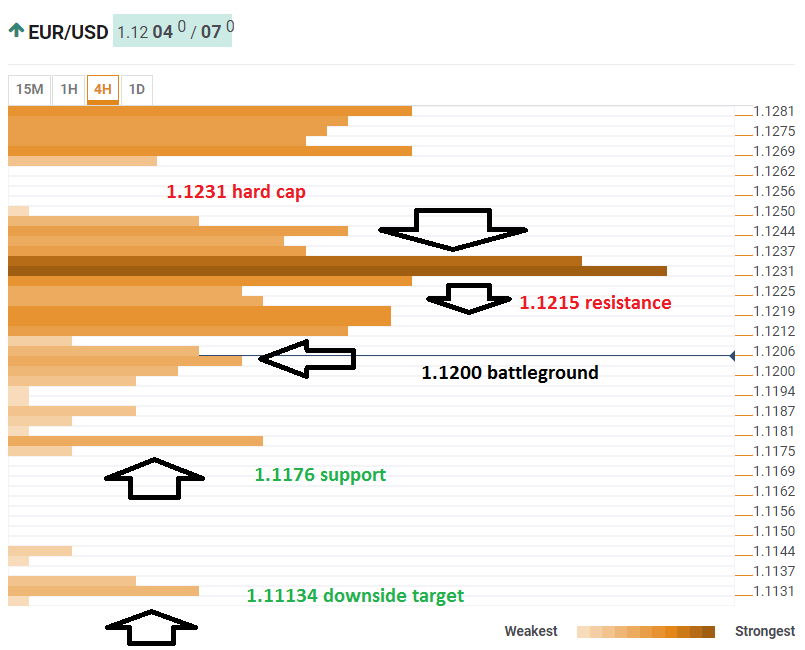
The Technical Confluences Indicator shows that EUR/USD faces initial resistance at 1.1215 which was the 2018 low, the Fibonacci 23.6% one-day, and the Bollinger Band 1h-Middle.
The next cap is quite close. At 1.1231 a dense cluster of lines awaits the pair: the Pivot Point one-month Support 3, the previous month’s low, the Fibonacci 38.2% one-day, and the Simple Moving Average 100-15m.
The pair is struggling at the round number of 1.1200 which is the convergence of the SMA 5-15m, the previous 4h-high, the BB 15min-Middle, and the BB 4h-Lower.
Support is at 1.1176 which is the fresh 2019 low. If euro/dollar extends its falls, the downside target is 1.1134 where we see the confluence of the PP one-day Support 1 and the Bollinger Band 1h-Lower.
Here is how it looks on the tool:
Confluence Detector
The Confluence Detector finds exciting opportunities using Technical Confluences. The TC is a tool to locate and point out those price levels where there is a congestion of indicators, moving averages, Fibonacci levels, Pivot Points, etc. Knowing where these congestion points are located is very useful for the trader, and can be used as a basis for different strategies.
This tool assigns a certain amount of “weight” to each indicator, and this “weight” can influence adjacents price levels. These weightings mean that one price level without any indicator or moving average but under the influence of two “strongly weighted” levels accumulate more resistance than their neighbors. In these cases, the tool signals resistance in apparently empty areas.
