EUR/USD extended its gradual slide, dipping below the round number of 1.1400. Can it recover? The technical levels suggest it may not be that easy.
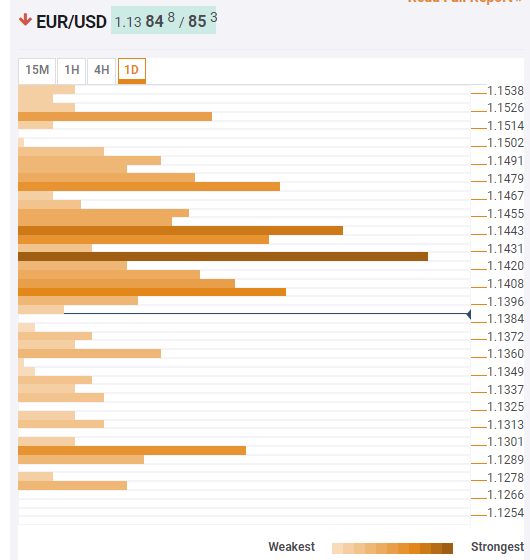
The Technical Confluences Indicator shows that the pair faces resistance at 1.1404 which is the confluence of the Bollinger Band 4h-Lower, the Simple Moving Average 10-15m, the SMA 5-1h, the BB 15-minutes Middle, and the SMA 50-1d.
The next considerable cap is not far off. At 1.1425 we find the convergence of the SMA 10-4h, the SMA 10-1d, the Fibonacci 38.2% one-day, the BB one-day Middle, the SMA 200-4h, the SMA 200-15m, and the SMA 50-1h.
On the downside, support is weak. At 1.1360 we find the lone Fibonacci 23.6% one-month indicator.
More significant support awaits only at 1.1295 where last month’s low and the Pivot Point one-month Support 1 converge.
Here is how it looks on the tool:
Confluence Detector
The Confluence Detector finds exciting opportunities using Technical Confluences. The TC is a tool to locate and point out those price levels where there is a congestion of indicators, moving averages, Fibonacci levels, Pivot Points, etc. Knowing where these congestion points are located is very useful for the trader, and can be used as a basis for different strategies.
This tool assigns a certain amount of “weight” to each indicator, and this “weight” can influence adjacents price levels. These weightings mean that one price level without any indicator or moving average but under the influence of two “strongly weighted” levels accumulate more resistance than their neighbors. In these cases, the tool signals resistance in apparently empty areas.
