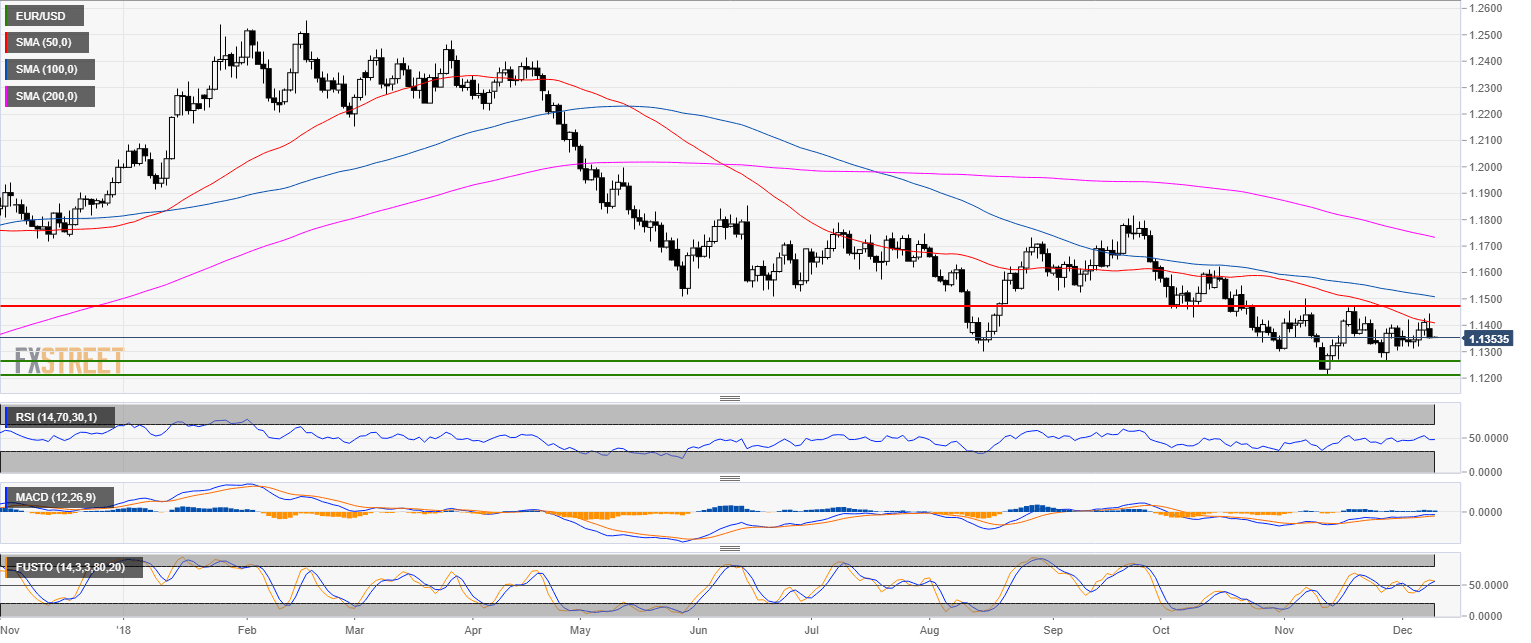
EUR/USD daily chart
- EUR/USD is trading in a bear trend below the 100 and 200-day simple moving average (SMA).
- EUR/USD rejected the 1.1400 figure along with the 50 SMA.
- As forecast at the start of the New York session, EUR/USD hit the 1.1360 target as the market is about to end the New York session near the 1.1354 level.
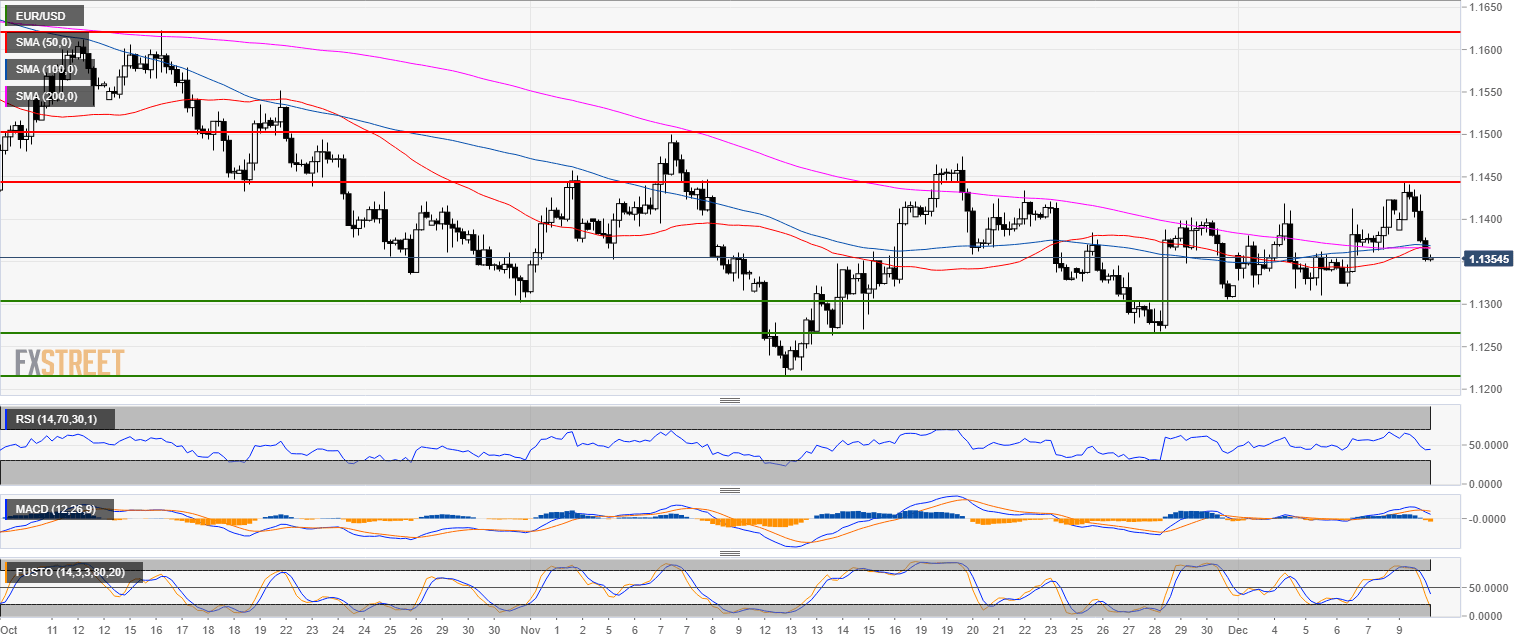
EUR/USD 4-hour chart
- EUR/USD is trading below its main SMAs suggesting that the market will trade back to 1.1300 figure.
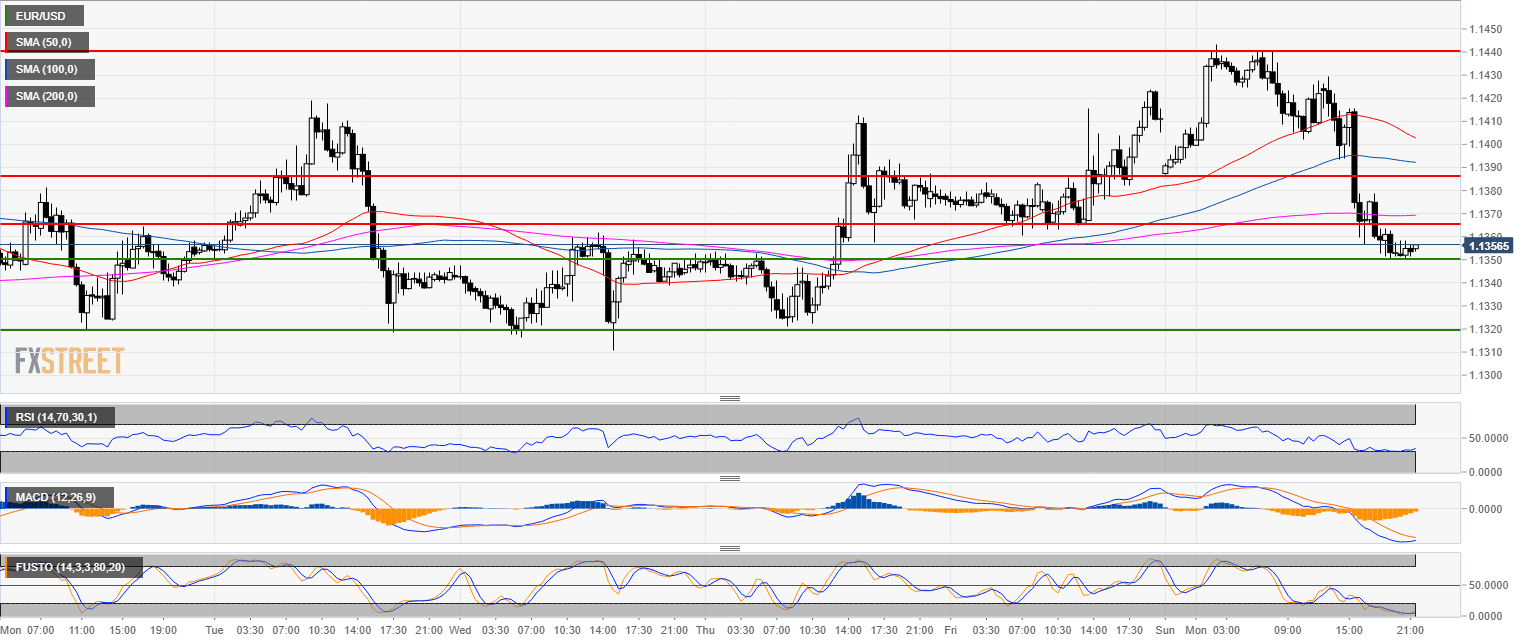
EUR/USD 30-minute chart
- On small time frames, the momentum is bearish although currently oversold, so bears should allow some room for a potential pullback up in the very short-term.
- Resistances to the upside are likely seen near 1.1365 and the 1.1385 level.
- Targets to the downside can be seen near 1.1320 and 1.1300 figure.
Additional key levels
EUR/USD
Overview:
Today Last Price: 1.1354
Today Daily change: -57 pips
Today Daily change %: -0.500%
Today Daily Open: 1.1411
Trends:
Previous Daily SMA20: 1.1353
Previous Daily SMA50: 1.1417
Previous Daily SMA100: 1.1515
Previous Daily SMA200: 1.1742
Levels:
Previous Daily High: 1.1424
Previous Daily Low: 1.136
Previous Weekly High: 1.1424
Previous Weekly Low: 1.1311
Previous Monthly High: 1.15
Previous Monthly Low: 1.1216
Previous Daily Fibonacci 38.2%: 1.14
Previous Daily Fibonacci 61.8%: 1.1385
Previous Daily Pivot Point S1: 1.1373
Previous Daily Pivot Point S2: 1.1335
Previous Daily Pivot Point S3: 1.131
Previous Daily Pivot Point R1: 1.1437
Previous Daily Pivot Point R2: 1.1462
Previous Daily Pivot Point R3: 1.15
