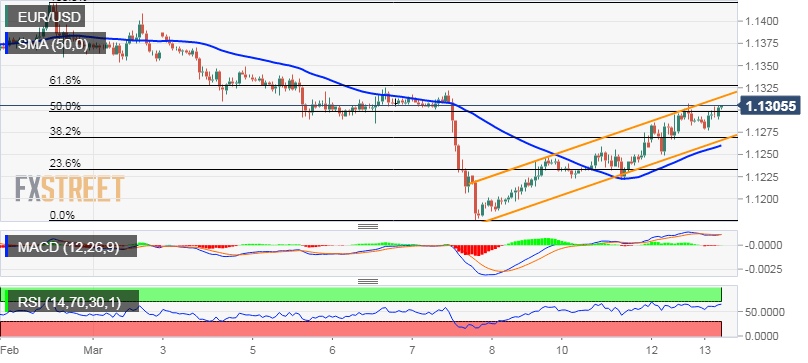
“¢ The pair maintained a mildly positive tone through the mid-European session, albeit continued with its struggle to build on the momentum further beyond the 1.1300 mark.
“¢ The mentioned handle coincides with 50% Fibonacci retracement level of the 1.1422-1.1176 recent slump and hence, should act as a key pivotal point for intraday traders.
“¢ Looking at a slightly bigger picture, the post-ECB recovery from the lowest level since June 2017 has been along an ascending trend-channel formation on the 1-hourly chart.
“¢ Given the recent decline over the past two weeks or so, the channel seemed to have constituted towards the formation of a bearish continuation flag chart pattern.
“¢ Hence, any subsequent move beyond the 1.1300 handle seems more likely to remain capped, rather meet with some fresh supply near the 1.1320 region (pre-ECB swing high).
“¢ Meanwhile, a convincing break below the 1.1270 confluence region – comprising of 38.2% Fibo. level, 50-hour SMA and the channel support, will further reinforce the bearish outlook.
EUR/USD 1-hourly chart
EUR/USD
Overview:
Today Last Price: 1.1302
Today Daily change: 15 pips
Today Daily change %: 0.13%
Today Daily Open: 1.1287
Trends:
Daily SMA20: 1.1315
Daily SMA50: 1.1369
Daily SMA100: 1.1371
Daily SMA200: 1.1494
Levels:
Previous Daily High: 1.1308
Previous Daily Low: 1.1244
Previous Weekly High: 1.1388
Previous Weekly Low: 1.1176
Previous Monthly High: 1.1489
Previous Monthly Low: 1.1234
Daily Fibonacci 38.2%: 1.1283
Daily Fibonacci 61.8%: 1.1268
Daily Pivot Point S1: 1.1252
Daily Pivot Point S2: 1.1217
Daily Pivot Point S3: 1.1189
Daily Pivot Point R1: 1.1315
Daily Pivot Point R2: 1.1343
Daily Pivot Point R3: 1.1378
