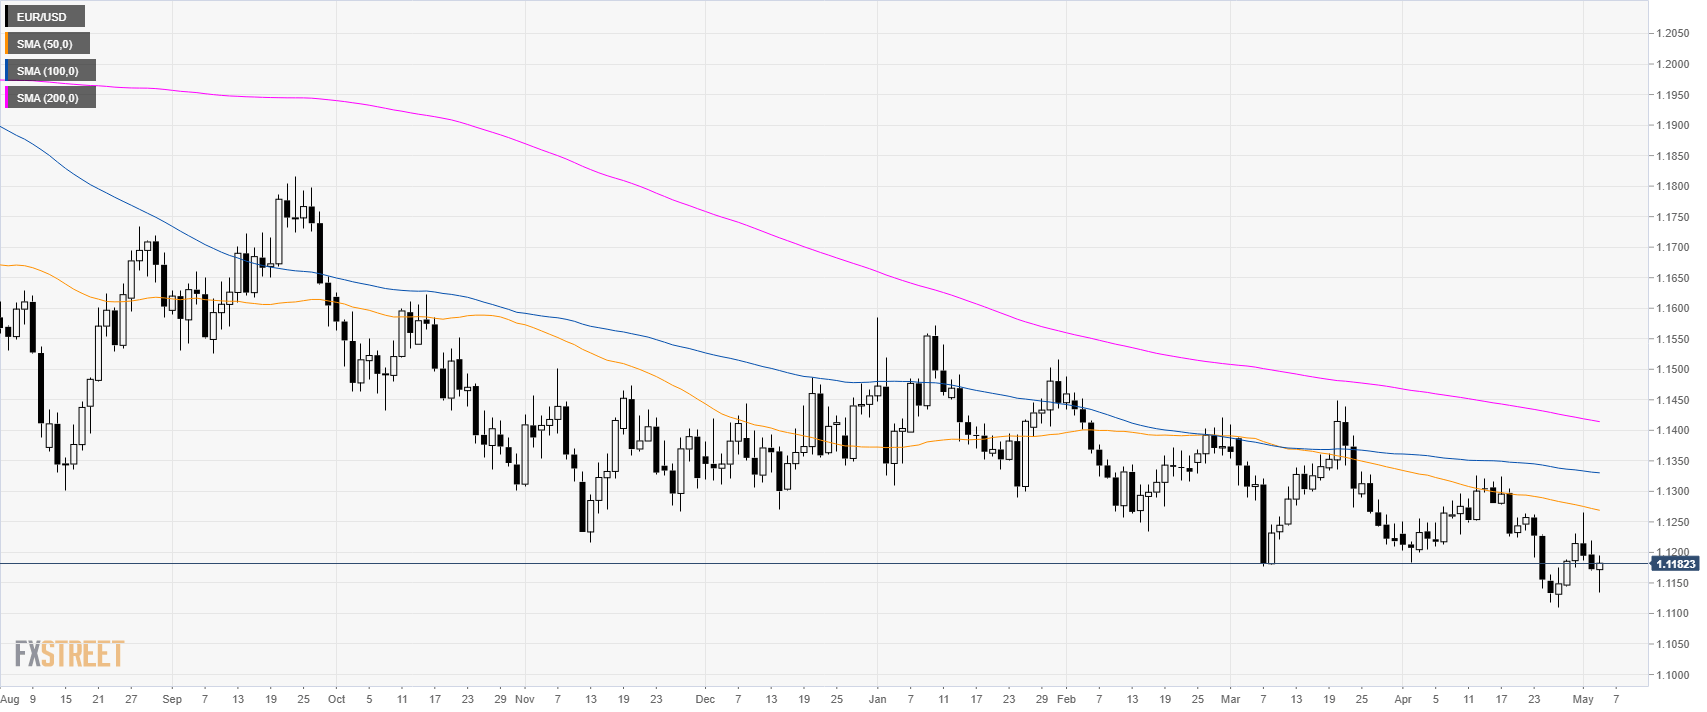
EUR/USD daily chart
- EUR/USD is trading in a bear trend below its main simple moving average (SMAs).
- Investors are dumping the US Dollar despite-better-than expected Nonfarm Payrolls (NFP) data in April at 3.2% vs. 3.3% while Average Hourly Earnings came in slightly lower-than-expected at 3.2% vs. 3.3% YoY in April.
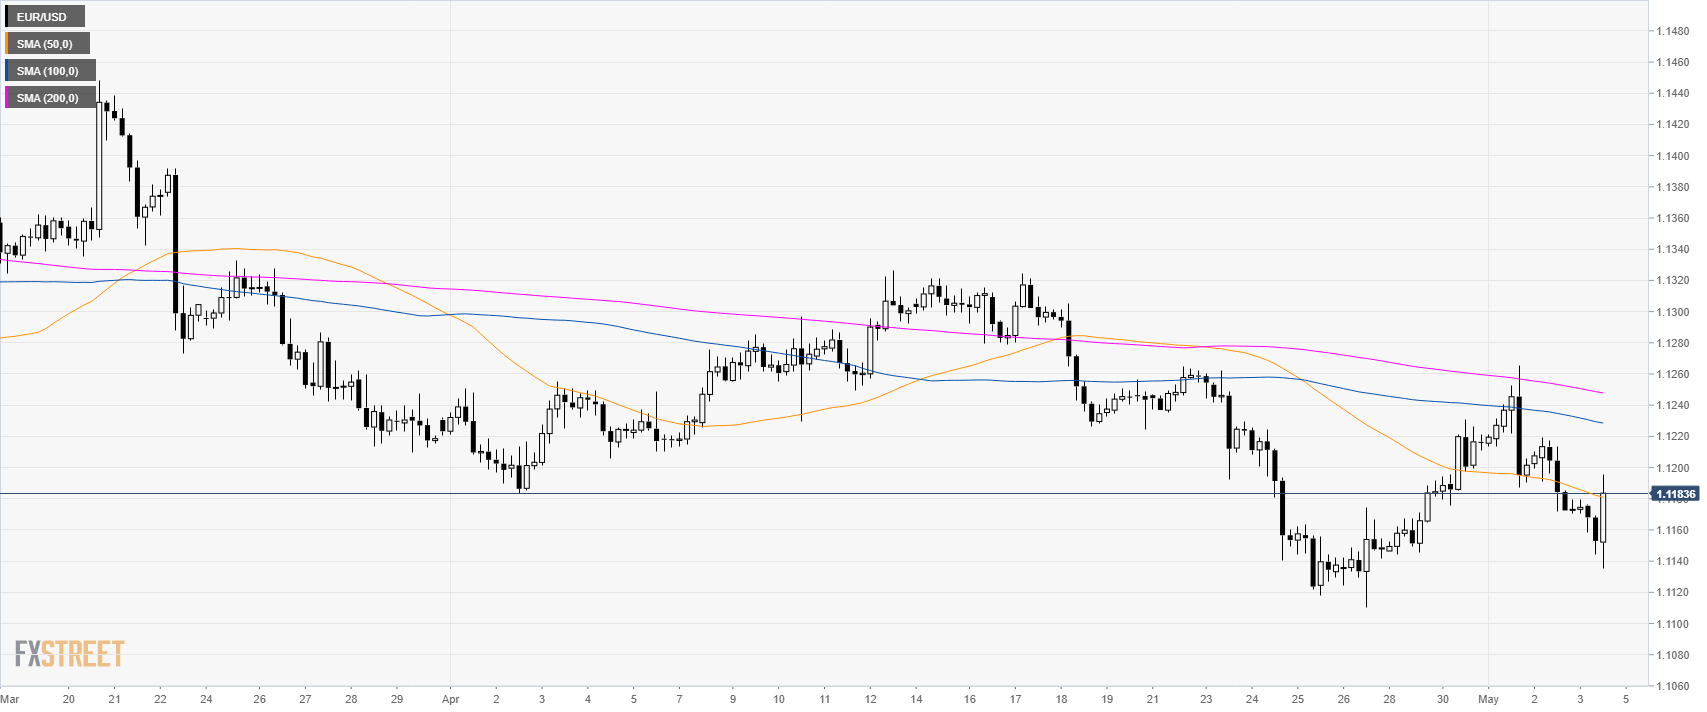
EUR/USD 4-hour chart
- EUR/USD is challenging 1.1200 figure and the 50 SMA.
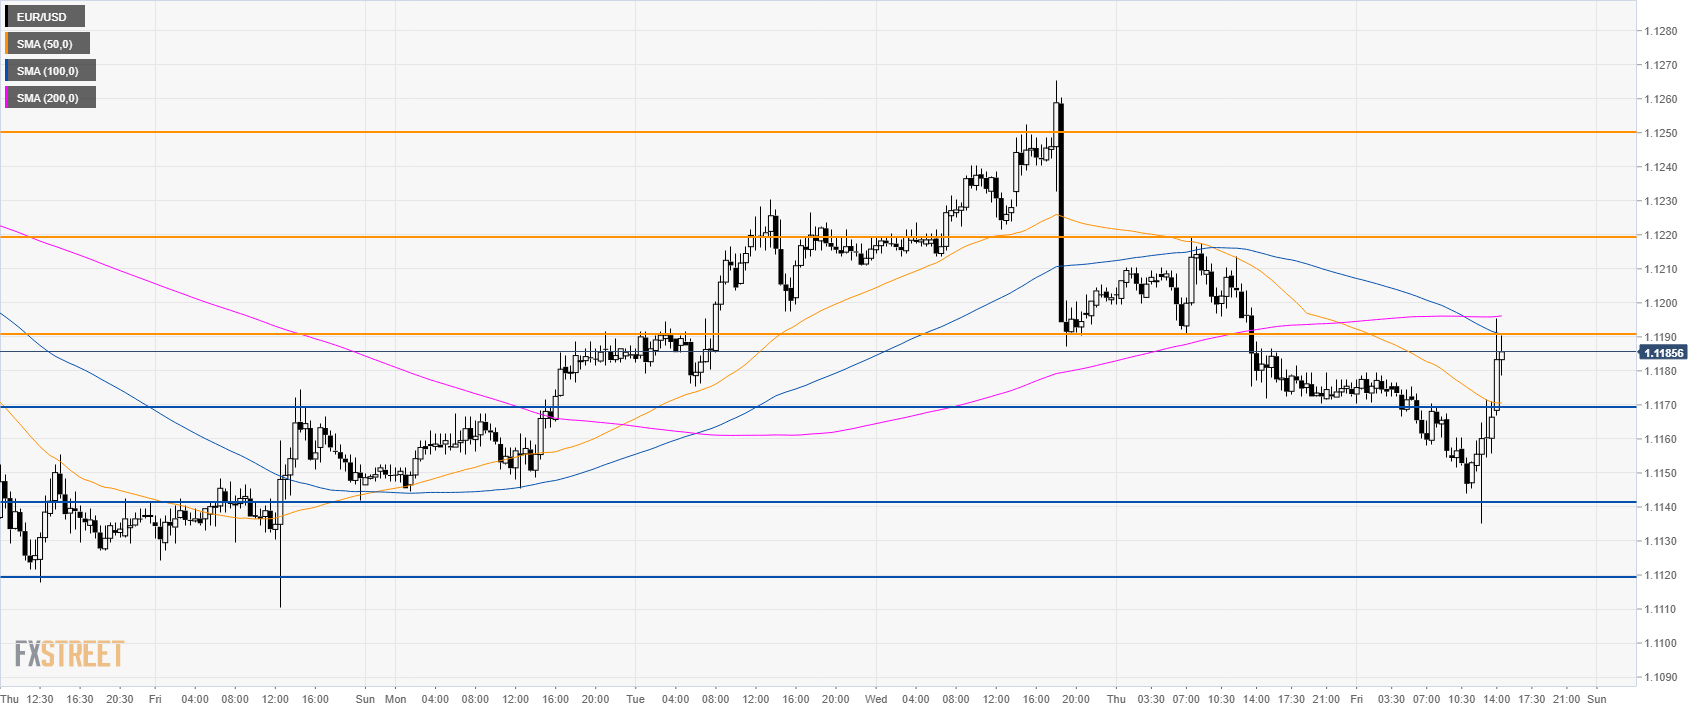
EUR/USD 30-minute chart
- Bulls created a surprise by reversing the previous daily losses. EUR/USD is trading between its 50 and 200 SMA suggesting a consolidation phase.
- If the market manages to trade beyond 1.1190 resistance the next pit-stop is at 1.1220 and 1.1250 if bulls gather enough steam.
- Support is seen at 1.1170 and 1.1140 level.
Additional key levels
