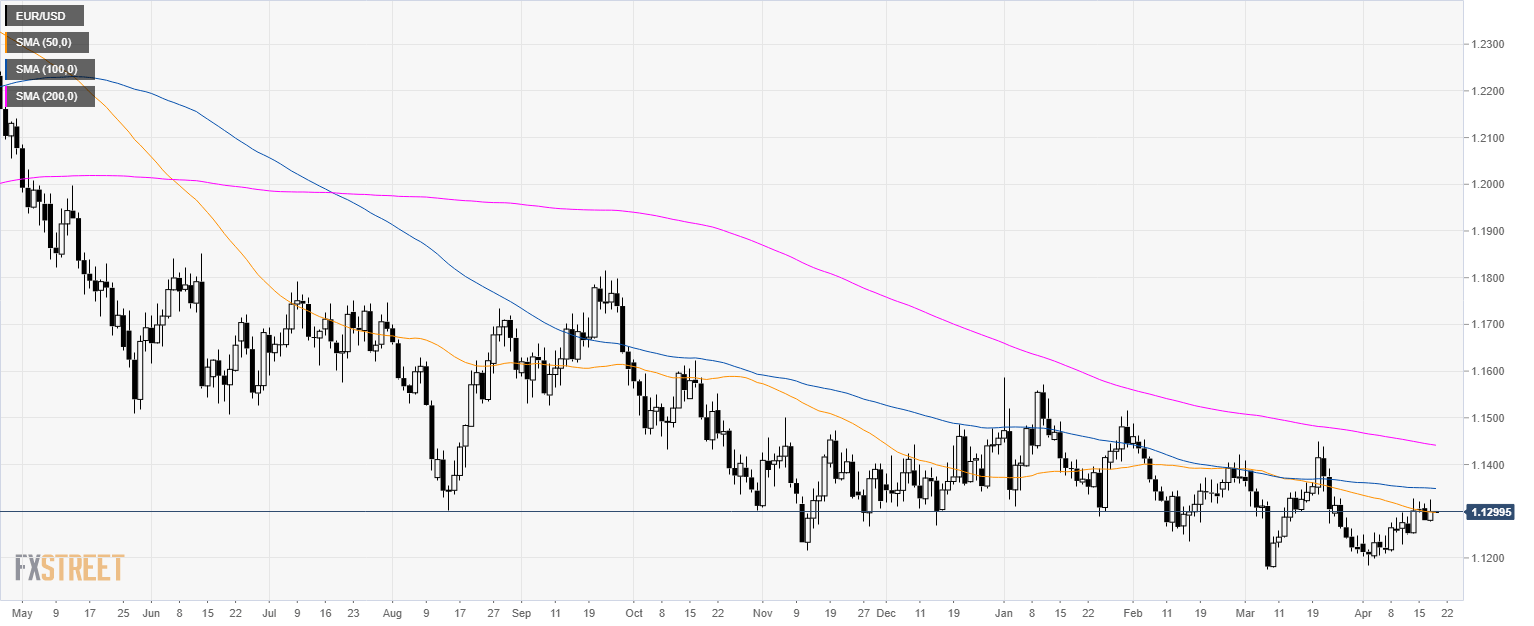
EUR/USD daily chart
- EUR/USD is trading in a bear trend below its 200-day simple moving average (SMA).
- EUR/USD has been capped by the 1.1330 resistance and the 50 SMA in the last days of trading.
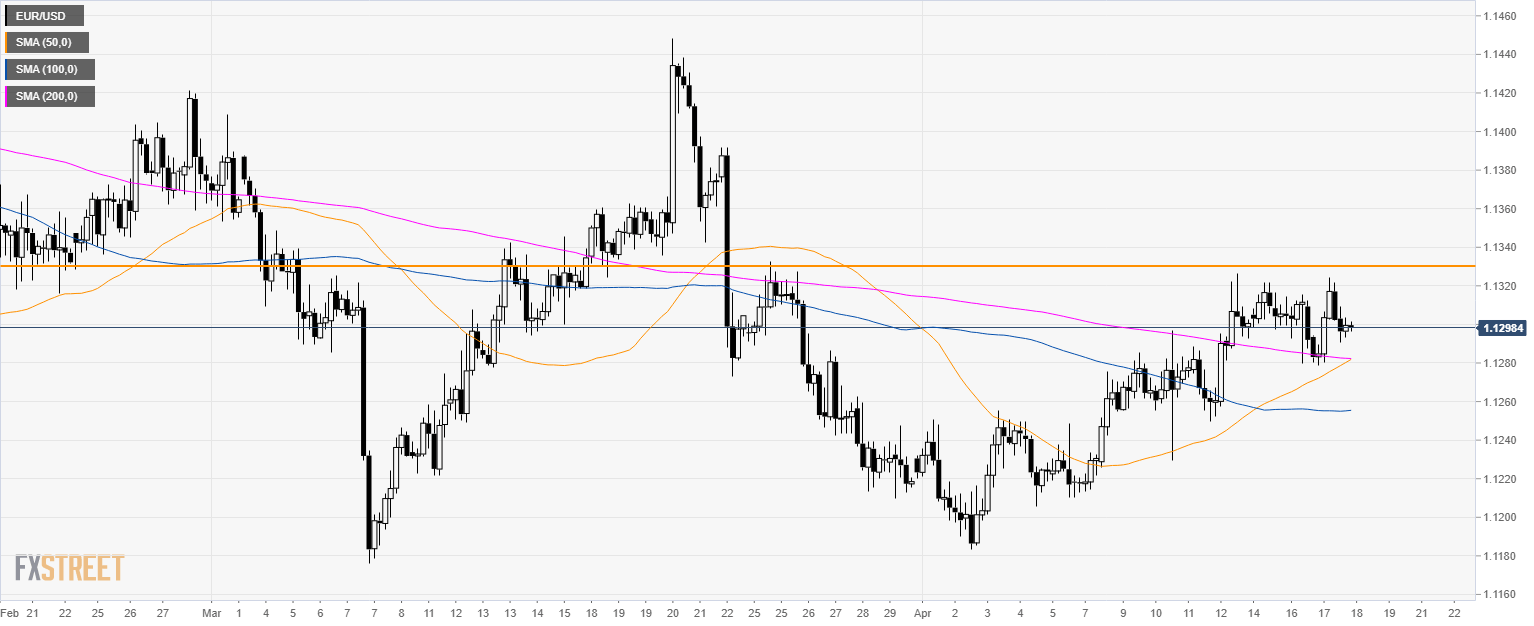
EUR/USD 4-hour chart
- EUR/USD formed a double top below 1.1330 resistance.
- EUR/USD is trading above its main SMAs suggesting a bullish bias in the medium-term.
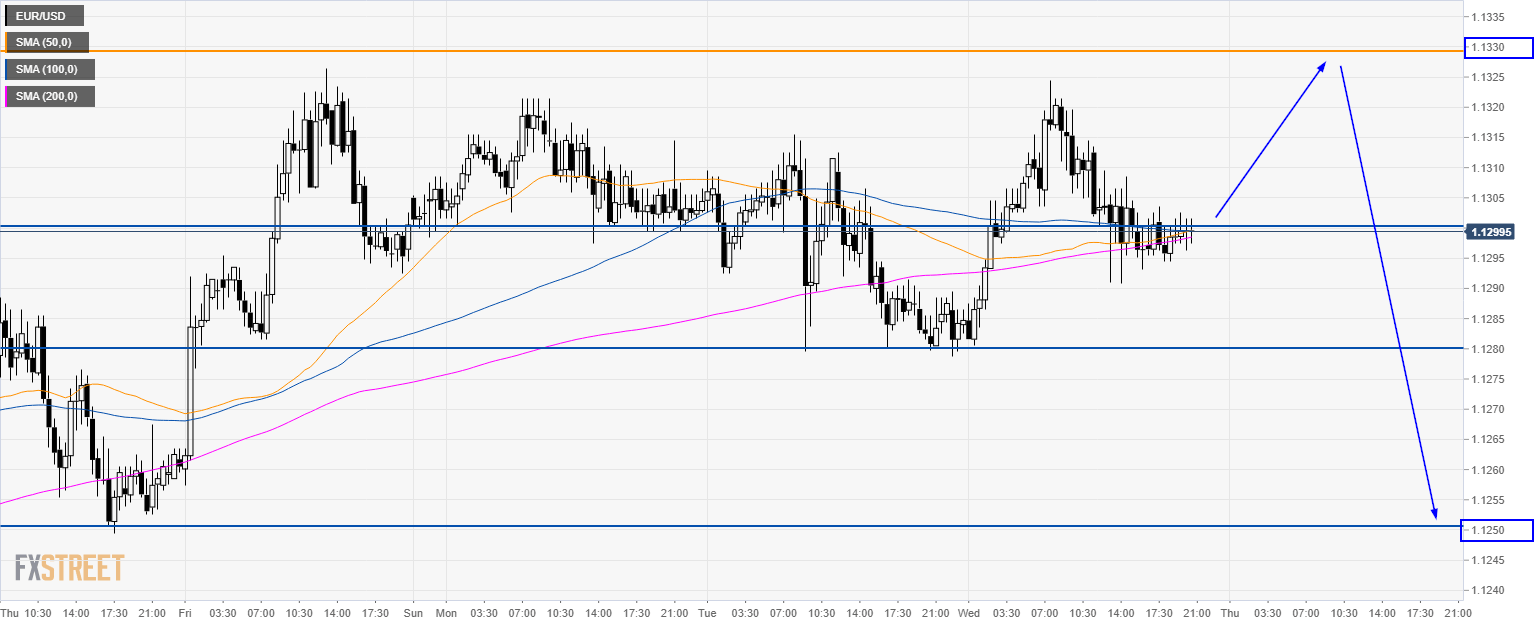
EUR/USD 30-minute chart
- The market is trading above its main SMAs suggesting bullish momentum in the near-term.
- EUR/USD might have a retest of 1.1330 resistance however bulls will need to break above it if they don’t want a retracement back into the current range.
- Bears will need to break below 1.1280 to travel to 1.1250 and 1.1220 if they gather enough momentum.
- Key resistance is at 1.1330. A break above the level would open the doors to 1.1360 level.
Additional key levels
