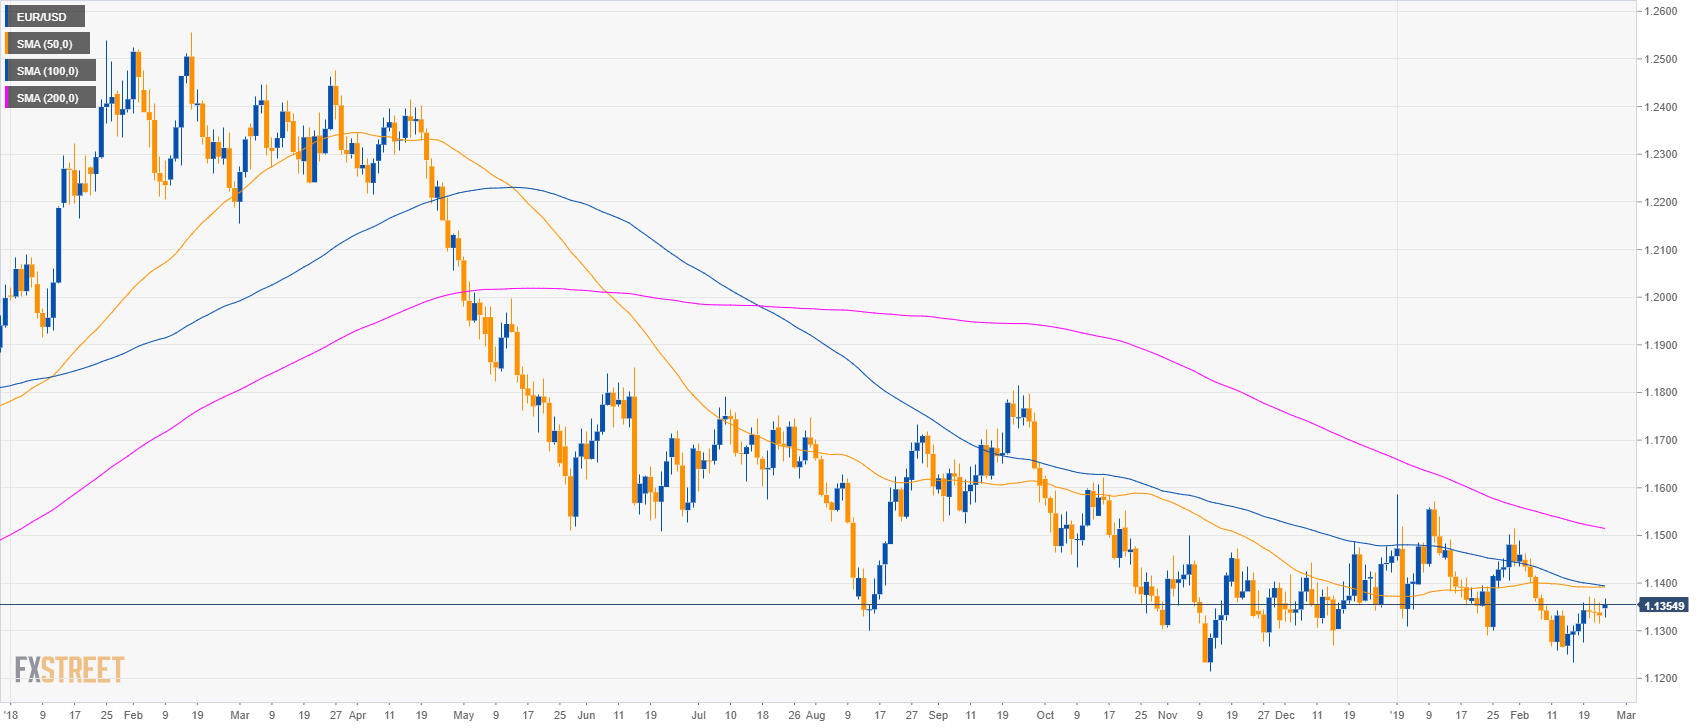
EUR/USD daily chart
- EUR/USD is trading in a bear trend below the 200-day simple moving average (SMA).
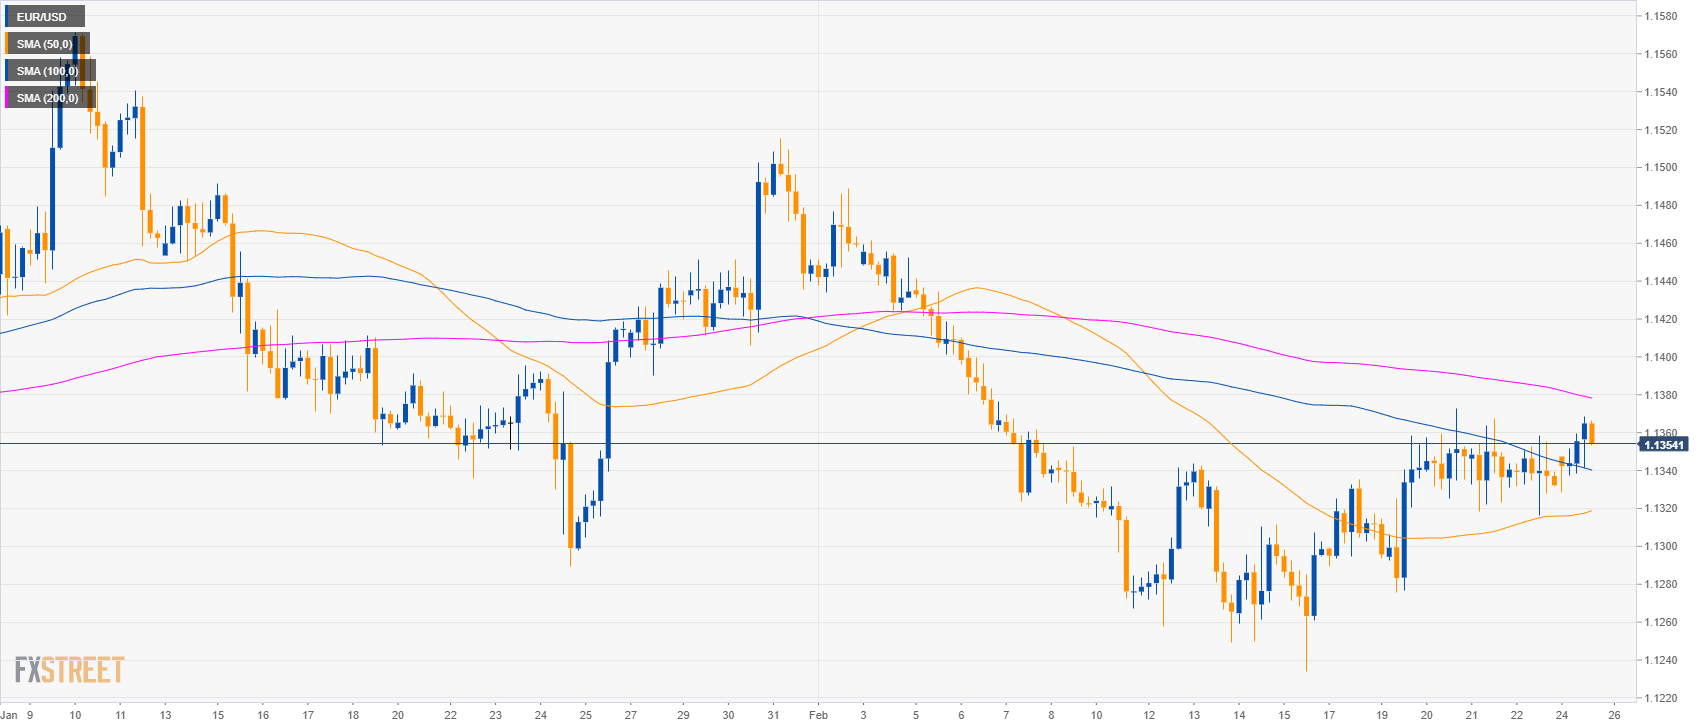
EUR/USD 4-hour chart
- EUR/USD is trading between the 100 and 200 SMA suggesting sideways action in the medium-term.
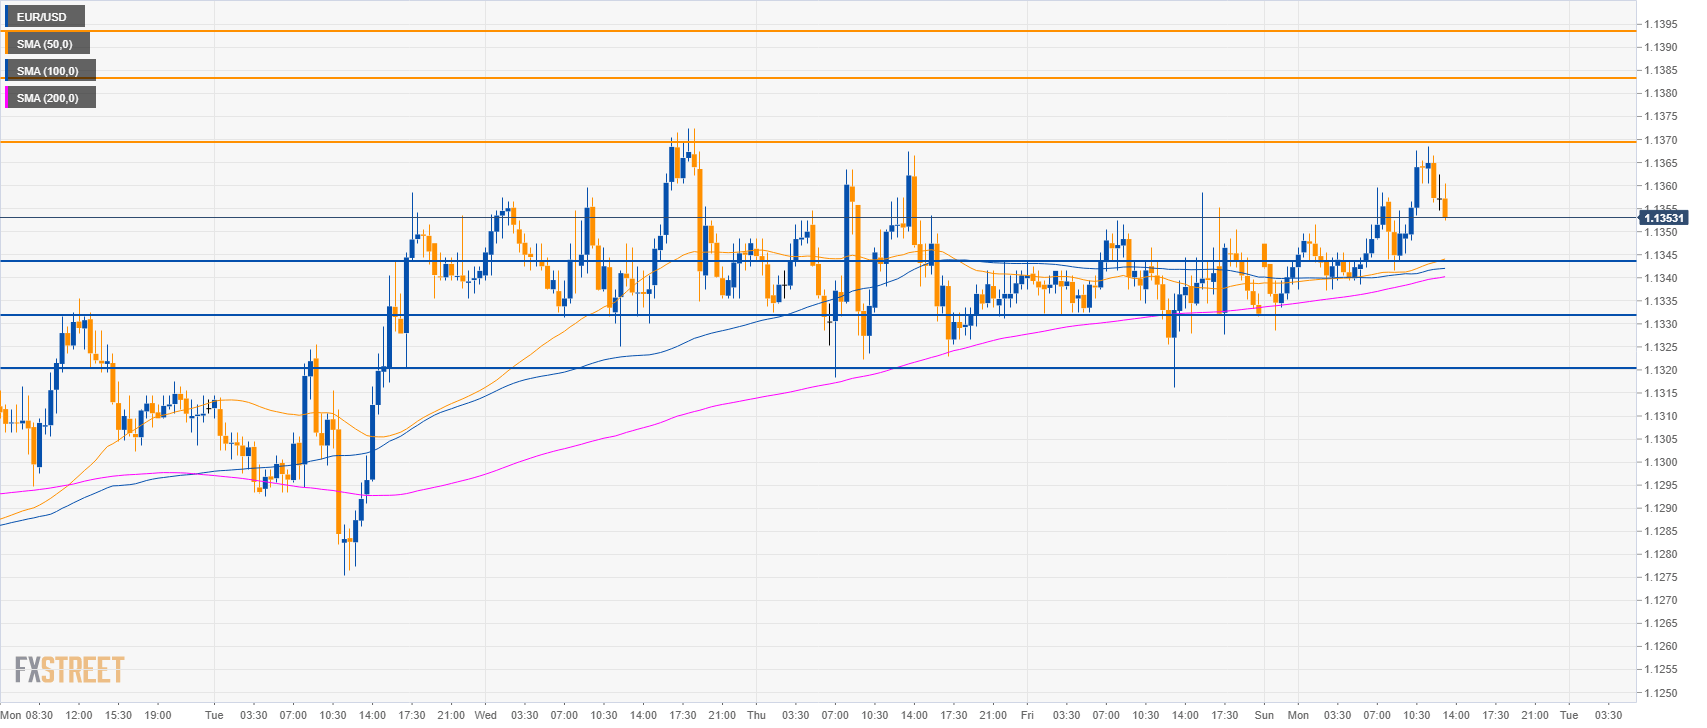
EUR/USD 30-minute chart
- EUR/USD is trading above its main SMAs suggesting bullish momentum in the short-term.
- On a break above 1.1370 bulls will be looking at 1.1383 and 1.1393 resistances.
- To the downside, support is at 1.1344, 1.1331 and 1.1321 levels.
Additional key levels
EUR/USD
Overview:
Today Last Price: 1.1356
Today Daily change: 24 pips
Today Daily change %: 0.21%
Today Daily Open: 1.1332
Trends:
Daily SMA20: 1.1363
Daily SMA50: 1.1392
Daily SMA100: 1.1395
Daily SMA200: 1.1517
Levels:
Previous Daily High: 1.1358
Previous Daily Low: 1.1316
Previous Weekly High: 1.1373
Previous Weekly Low: 1.1276
Previous Monthly High: 1.1586
Previous Monthly Low: 1.1289
Daily Fibonacci 38.2%: 1.1332
Daily Fibonacci 61.8%: 1.1342
Daily Pivot Point S1: 1.1313
Daily Pivot Point S2: 1.1293
Daily Pivot Point S3: 1.127
Daily Pivot Point R1: 1.1355
Daily Pivot Point R2: 1.1378
Daily Pivot Point R3: 1.1397
