EUR/USD is resting above the 1.1118-1.1109 support band amid oversold readings on the hourly and 4-hour chart relative strength index.
Repeated defense of that support line could yield a minor bounce, which could end up recharging fuels for a deeper drop below 1.10, as the pair dived out of the multi-month trading range of 1.12-1.15 earlier this week, putting the bears in a commanding position.
Weekly chart
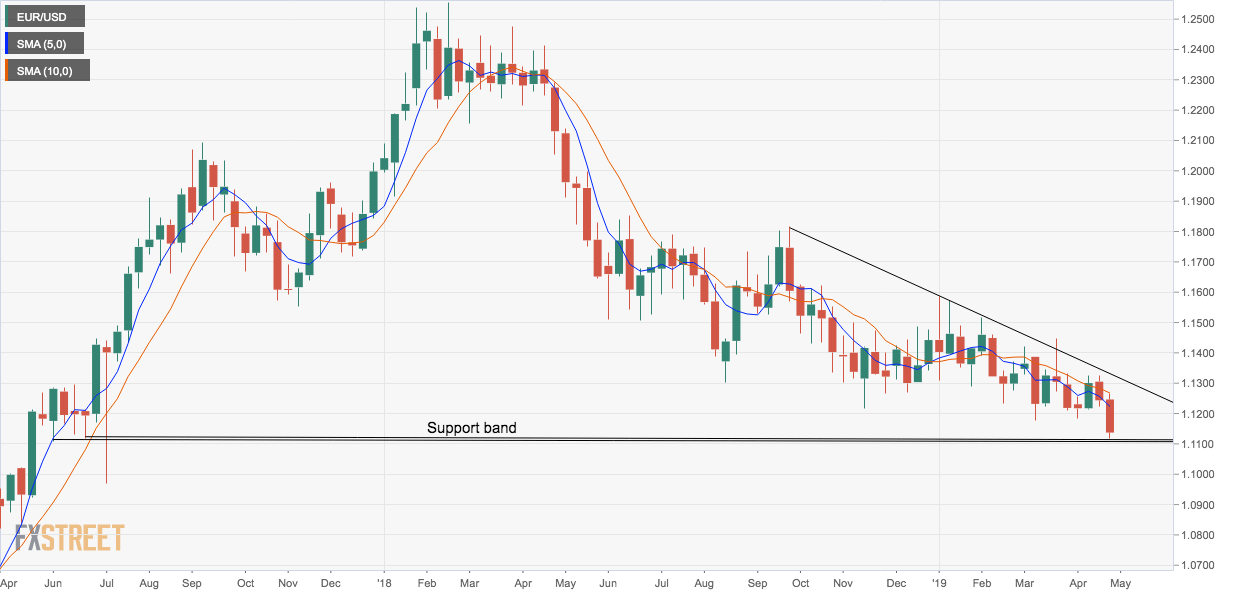
- The falling trendline, representing lower highs and the downward sloping 5- and 10-week moving averages (MAs) indicate the path of least resistance is to the downside.
- A weekly close below 1.1176 would only bolster the already bearish technical setup, strengthening the case for a drop to 1.10.
- A close above the 10-week MA would neutralize the bearish setup.
4-hour chart
-636918420863098103.png)
- As seen above, the RSI is reporting the oversold condition. So, the spot may hold the 1.1118-1.1109 support band for the next few hours.
- A decisive break lower could happen if the US first-quarter GDP prints well above estimates. The data is scheduled for release at 12:30 GMT. It is worth noting that markets have bought US dollars over the last five trading days, possibly in anticipation of upbeat GDP. As a result, the GDP figure will have to beat expectations by a big margin to push the greenback higher.
Trend: Bearish
