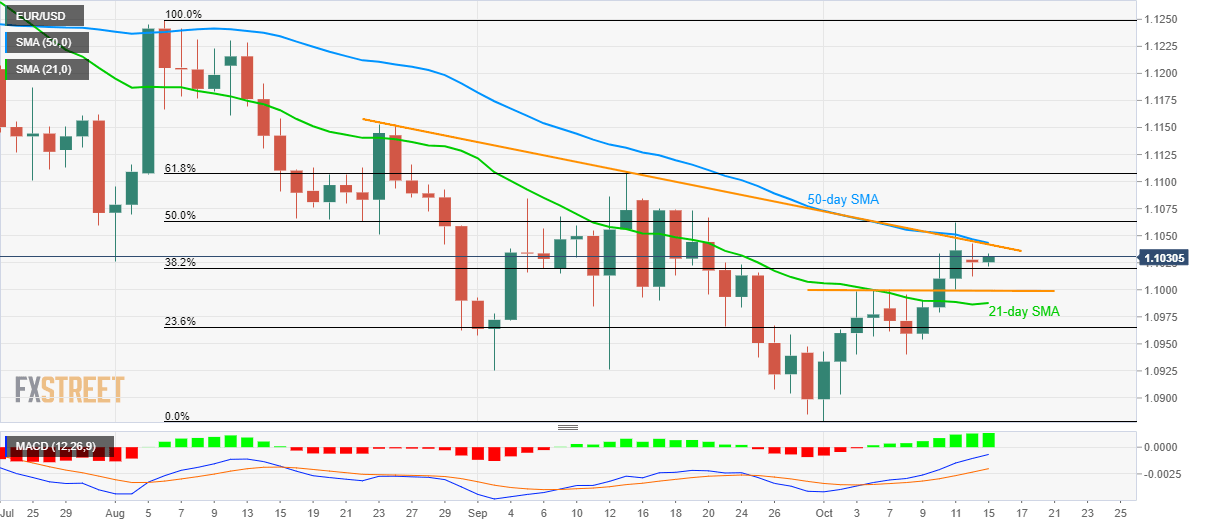
- EUR/USD on the recovery mode from 38.2% Fibonacci retracement.
- 50-day SMA, seven-week-old falling trendline limits immediate upside.
- Doji on the daily (D1) chart doubts the latest pullback.
The EUR/USD pair’s latest recovery seems to be challenged soon considering Monday’s Doji candlestick formation on D1 and nearness to the key resistance-confluence. The quote currently takes the bids to 1.1030 by the press time of Tuesday morning in Asia.
Among the resistances, 50-day Simple Moving Average (SMA) and a downward sloping trend-line since late-August, around 1.1040/45, becomes the key for buyers as a break of which can escalate the recovery to 50% Fibonacci retracement of August-October downpour, at 1.1065 now.
During the pair’s further rise beyond 1.1065, 61.8% Fibonacci retracement near 1.1110 and August 23 high surrounding 1.1155 will lure buyers.
On the downside break below 38.2% Fibonacci retracement near 1.1020, the pair can revisit eight-day-old horizontal support around 1.1000 mark.
However, pair’s declines below 1.1000 may struggle to conquer a 21-day SMA level of 1.0985 and last week’s low nearing 1.0940.
EUR/USD daily chart
Trend: pullback expected
