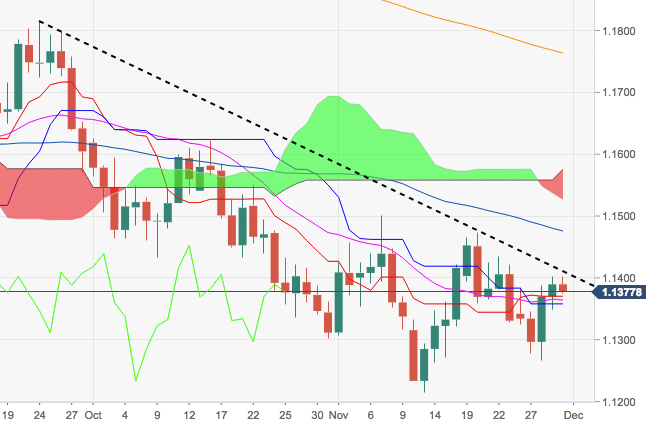
- The pair comes under some selling pressure at the end of the week after two consecutive daily advances and a couple of failed attempts to break above the 1.1400 mark.
- The negative bias is poised to persist as long as the pair trades below November’s peak in the 1.1500 neighbourhood, leaving a test of YTD lows around 1.1200 well on the cards.
- On the upside, interim hurdle emerges at recent tops in the 1.1470/80 band.
EUR/USD daily chart
EUR/USD
Overview:
Today Last Price: 1.1379
Today Daily change: -11 pips
Today Daily change %: -0.0966%
Today Daily Open: 1.139
Trends:
Previous Daily SMA20: 1.1364
Previous Daily SMA50: 1.146
Previous Daily SMA100: 1.1534
Previous Daily SMA200: 1.177
Levels:
Previous Daily High: 1.1402
Previous Daily Low: 1.1348
Previous Weekly High: 1.1473
Previous Weekly Low: 1.1328
Previous Monthly High: 1.1625
Previous Monthly Low: 1.1302
Previous Daily Fibonacci 38.2%: 1.1382
Previous Daily Fibonacci 61.8%: 1.1369
Previous Daily Pivot Point S1: 1.1358
Previous Daily Pivot Point S2: 1.1326
Previous Daily Pivot Point S3: 1.1304
Previous Daily Pivot Point R1: 1.1412
Previous Daily Pivot Point R2: 1.1434
Previous Daily Pivot Point R3: 1.1466
