- The EUR/USD major pairing is looking at some quick selling heading into the European market session after a mild bid through Tuesday’s early trading.
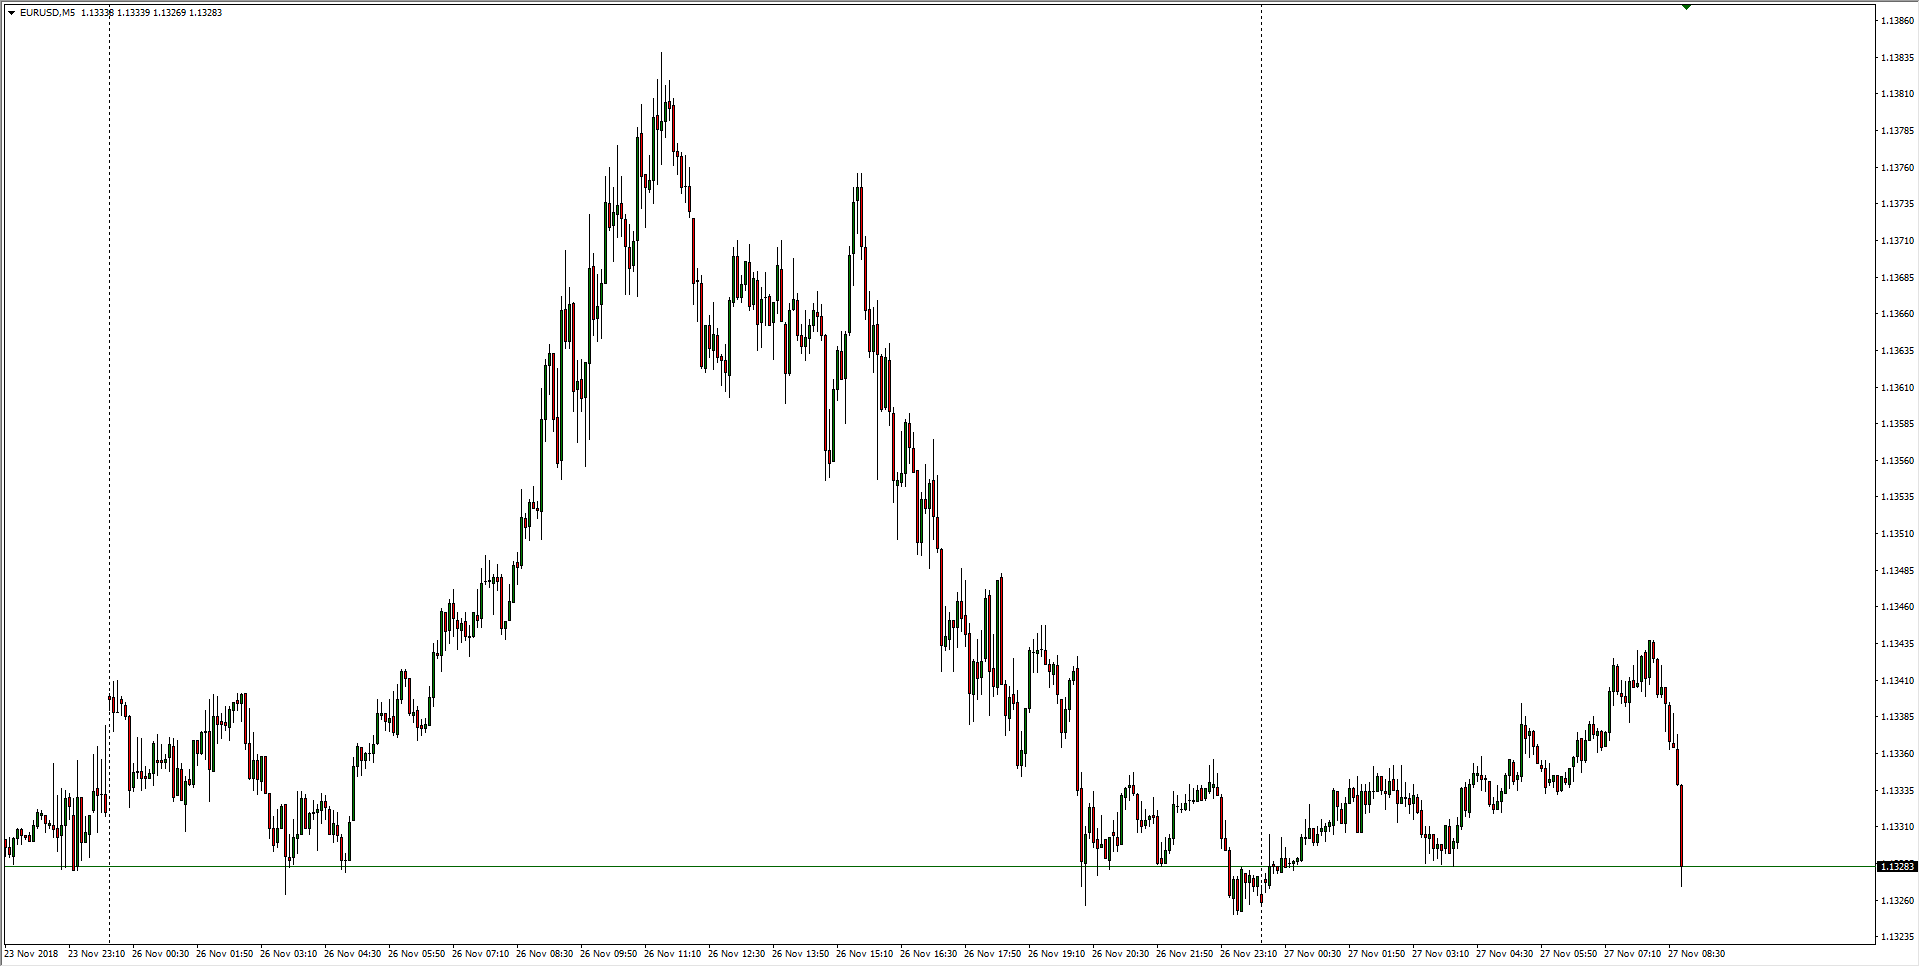
- The previous twenty-four hours saw the Euro pick up to the 1.1380 region before ducking back down to the week’s open just above the 1.1300 barrier.
EUR/USD Chart, 5-Minute
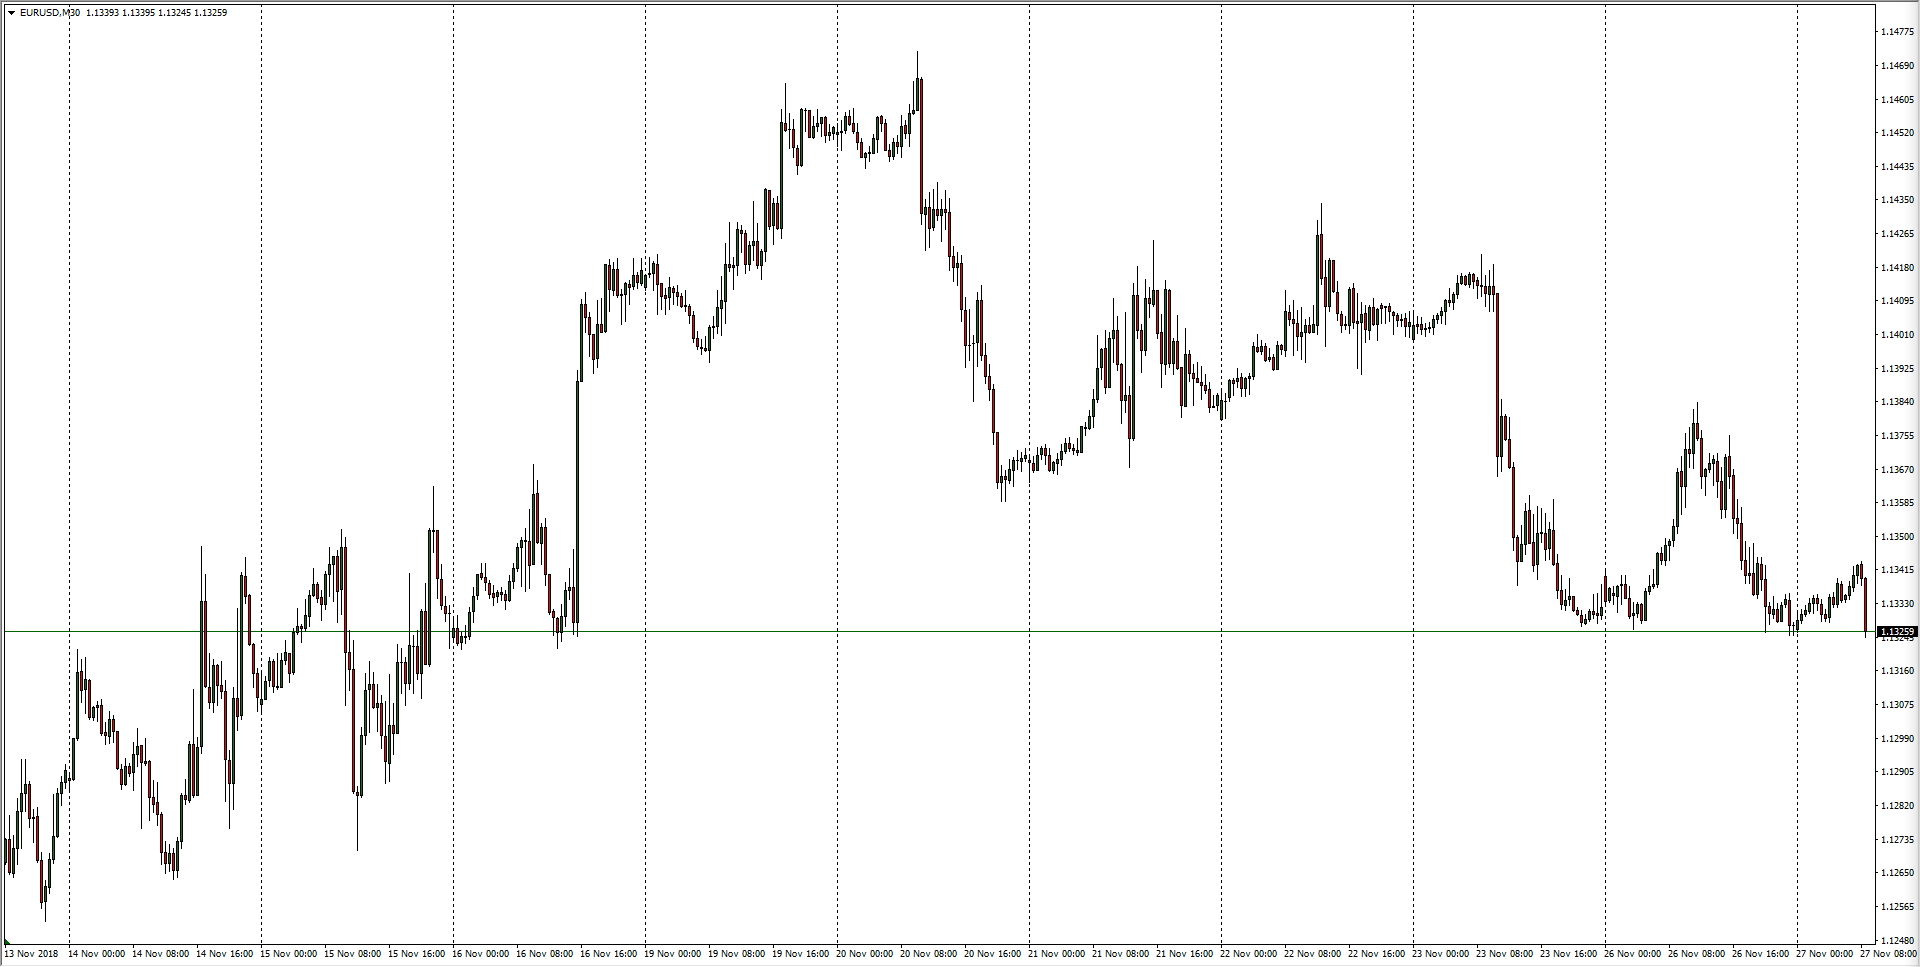
- Over the past two weeks the EUR/USD has begun to round out, and swing highs are beginning to see capping action as broader markets begin to swing bullish on the Greenback.
EUR/USD Chart, 30-Minute
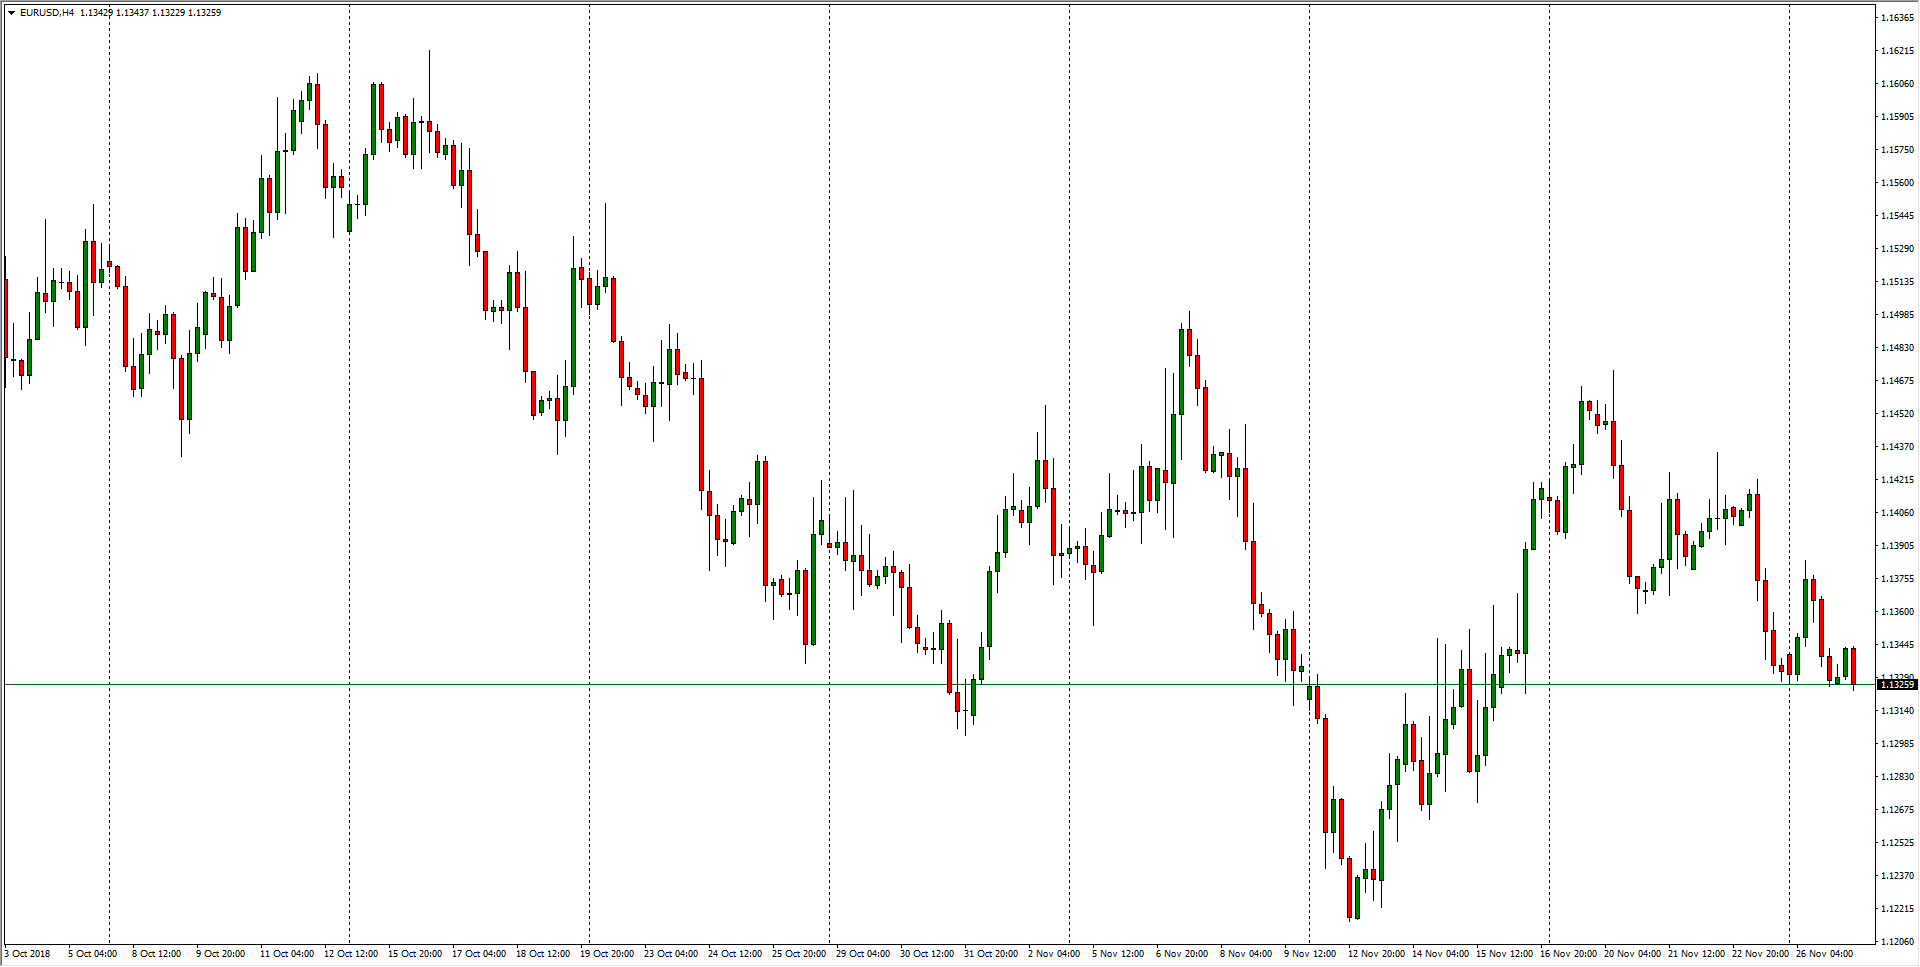
- The past two months shows the Fiber setting up for a bearish continuation in the mid-term, and the next leg down will see sellers targeting beyond the 1.1240 level.
EUR/USD Chart, 4-Hour
EUR/USD
Overview:
Today Last Price: 1.1334
Today Daily change: 0.0 pips
Today Daily change %: 0.00%
Today Daily Open: 1.1334
Trends:
Previous Daily SMA20: 1.1364
Previous Daily SMA50: 1.1481
Previous Daily SMA100: 1.1544
Previous Daily SMA200: 1.1785
Levels:
Previous Daily High: 1.1384
Previous Daily Low: 1.1326
Previous Weekly High: 1.1473
Previous Weekly Low: 1.1328
Previous Monthly High: 1.1625
Previous Monthly Low: 1.1302
Previous Daily Fibonacci 38.2%: 1.1348
Previous Daily Fibonacci 61.8%: 1.1362
Previous Daily Pivot Point S1: 1.1312
Previous Daily Pivot Point S2: 1.1289
Previous Daily Pivot Point S3: 1.1253
Previous Daily Pivot Point R1: 1.137
Previous Daily Pivot Point R2: 1.1406
Previous Daily Pivot Point R3: 1.1429
