- EUR/USD is having a small pullback just below the 1.1700 level. The strength of the pullback is rather weak suggesting that bulls will need more in order to break through the level.
- In addition, EUR/USD bulls would need to break above the trendline and the 200-period simple moving average if they want to extend the current bullish reversal attempt.
- To the downside, the line in the sand for bears is the 1.1640, a break below the level would likely see an acceleration towards 1.1600. On the flip side, a strong breakout above 1.1700 can see a retest of the 1.1720-1.1730-1.1740 area, with the June 26 high, the 23.6% Fibonacci retracement from mid-April-May bear move and the weekly open, which is quite a lot of resistance to go through. A breakout above this area would be considered negative for bears.
EUR/USD 15-minute chart
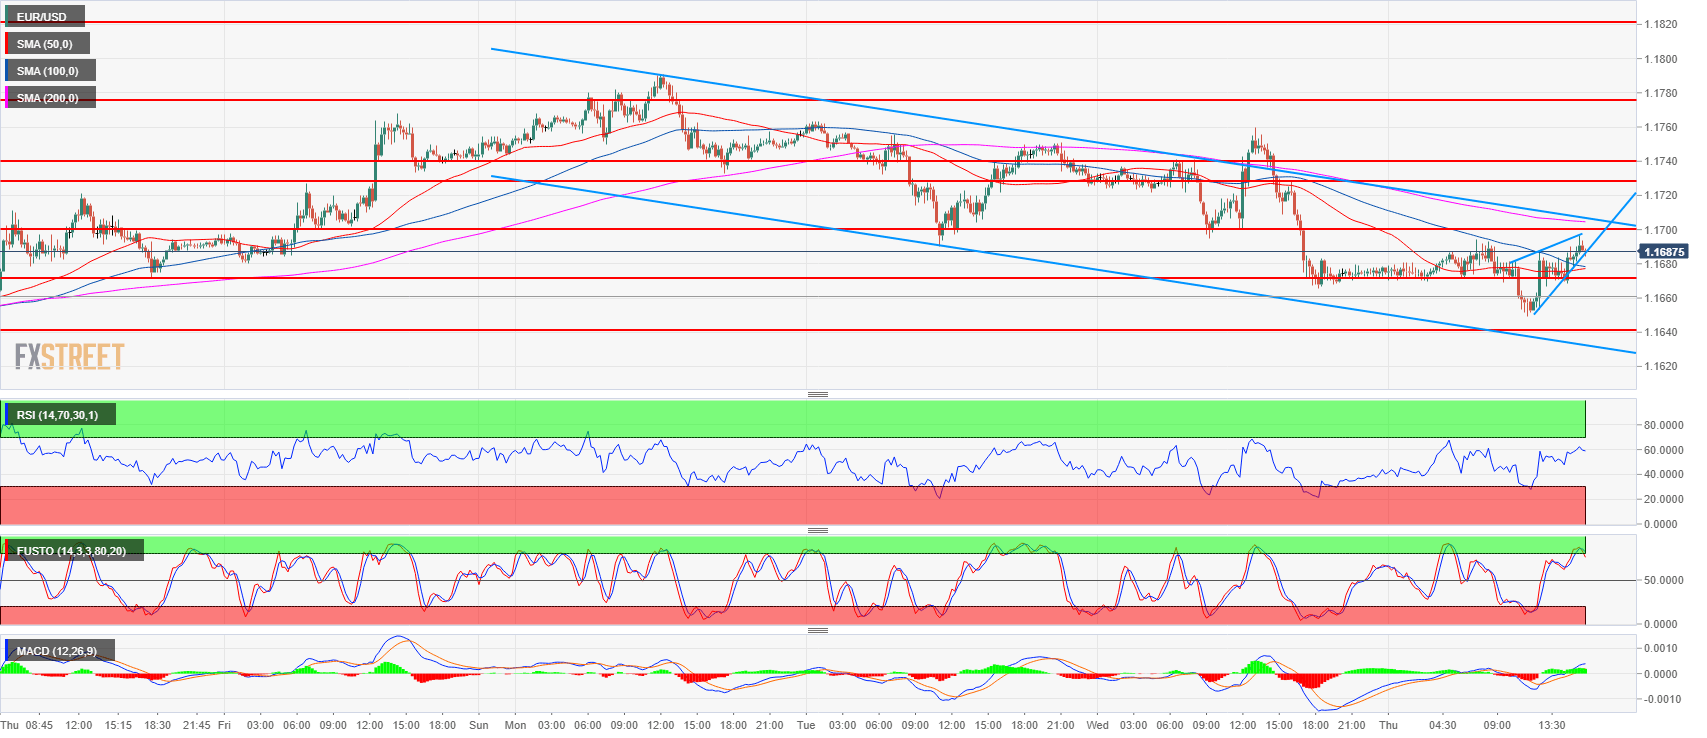
Spot rate: 1.1685
Relative change: 0.10%
High: 1.1696
Low: 1.1649
Trend: Bearish
Resistance 1: 1.1700 figure
Resistance 2: 1.1720-1.1730-1.1740 area, June 26 high, 23.6% Fibonacci retracement from mid-April-May bear move and weekly open.
Resistance 3: 1.1775 supply level
Resistance 4: 1.1800 figure
Resistance 5: 1.1851-1.1854 area, June high and 38.2% Fibonacci retracement from mid-April-May bear move
Support 1: 1.1672 June 27 high
Support 2: 1.1640 supply/demand level
Support 3: 1.1600 figure
Support 4: 1.1560 June 14 low
Support 5: 1.1508 current 2018 low
