- EUR/USD broke above the 1.1700 figure and is currently trading close to its daily high near 1.1716 after testing the 1.1720 resistance.
- The 50 and 100-period simple moving averages are now trending up above the 200 SMA confirming the bullish bias. If EUR/USD manages to stay above 1.1700 that would be another bullish clue.
- As EUR/USD is approaching the key 1.1730-1.1750 area some strong resistance is to be expected, however, there is no sign of a top just yet and nothing indicates that the bullish momentum is over.
EUR/USD 15-minute chart
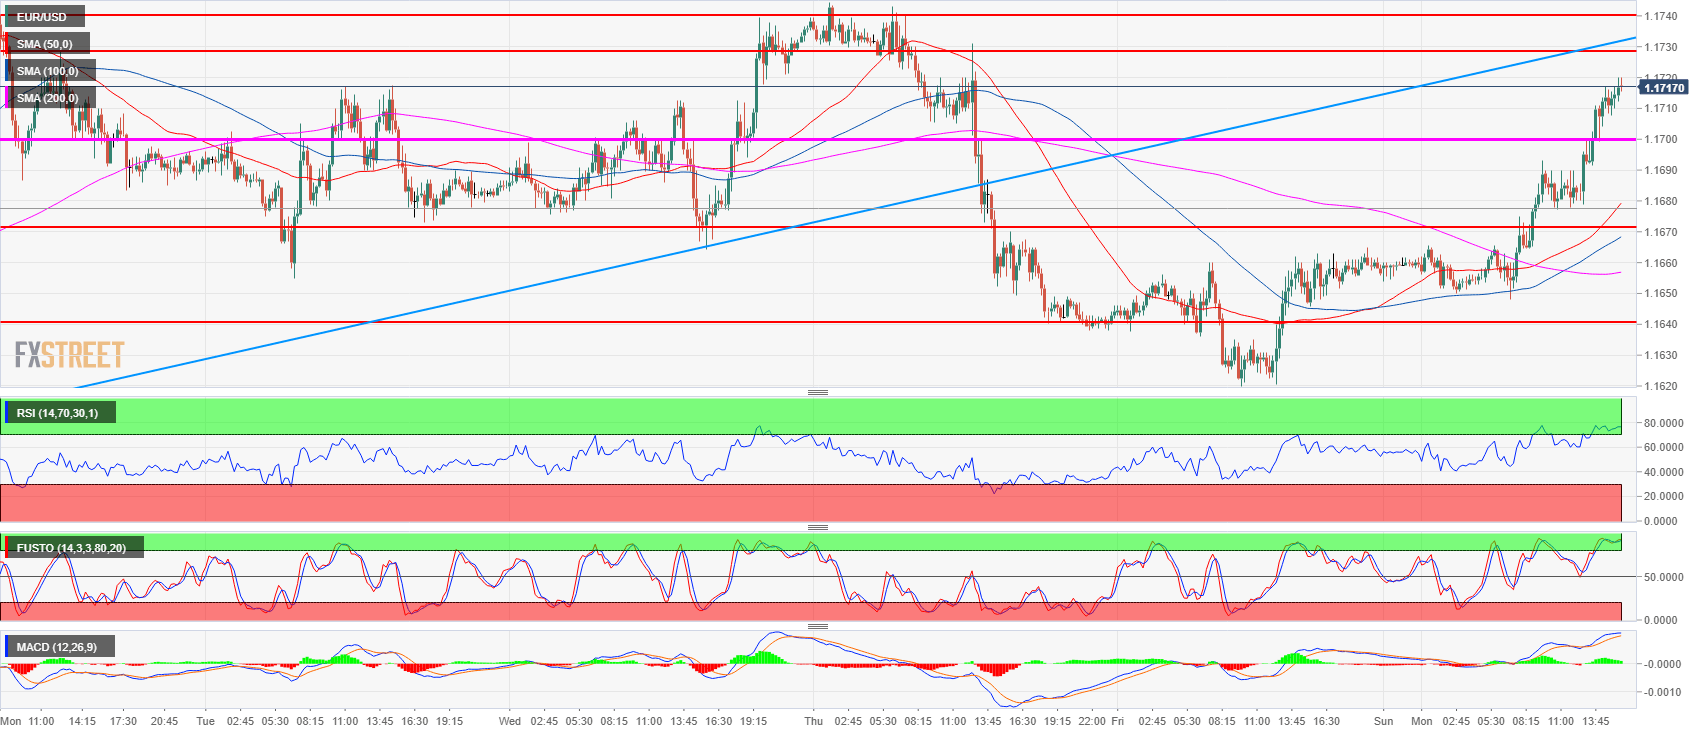
Spot rate: 1.1716
Relative change: 0.52%
High: 1.1720
Low: 1.1648
Trend: Bearish / Bullish pullback / Risk of trend reversal above 1.1730-1.1750
Resistance 1: 1.1730-1.1740-1.1750 area, 23.6% Fibonacci retracement mid-April-May bear move, weekly high.
Resistance 2: 1.1760-1.1795 supply levels
Resistance 3: 1.1851-1.1854 area, June high and 38.2% Fibonacci retracement from mid-April-May bear move
Support 1: 1.1700 figure
Support 2: 1.1672 June 27 high
Support 3: 1.1649 July 12 low
Support 4: 1.1640-1.1649 key level and July 12 low
Support 5: 1.1600-1.1613 figure and July 13 low
Support 6: 1.1560 June 14 low
Support 7: 1.1508 current 2018 low
